
FIREX-AQ 2019 (Fire Influence on Regional to Global Environments and Air Quality)
https://espo.nasa.gov/firex-aq
Description
The overarching objective of FIREX-AQ is to provide measurements of trace gas and aerosol emissions for wildfires and prescribed fires in great detail, relate them to fuel and fire conditions at the point of emission, characterize the conditions relating to plume rise, follow plumes downwind to understand chemical transformation and air quality impacts, and assess the efficacy of satellite detections for estimating the emissions from sampled fires.
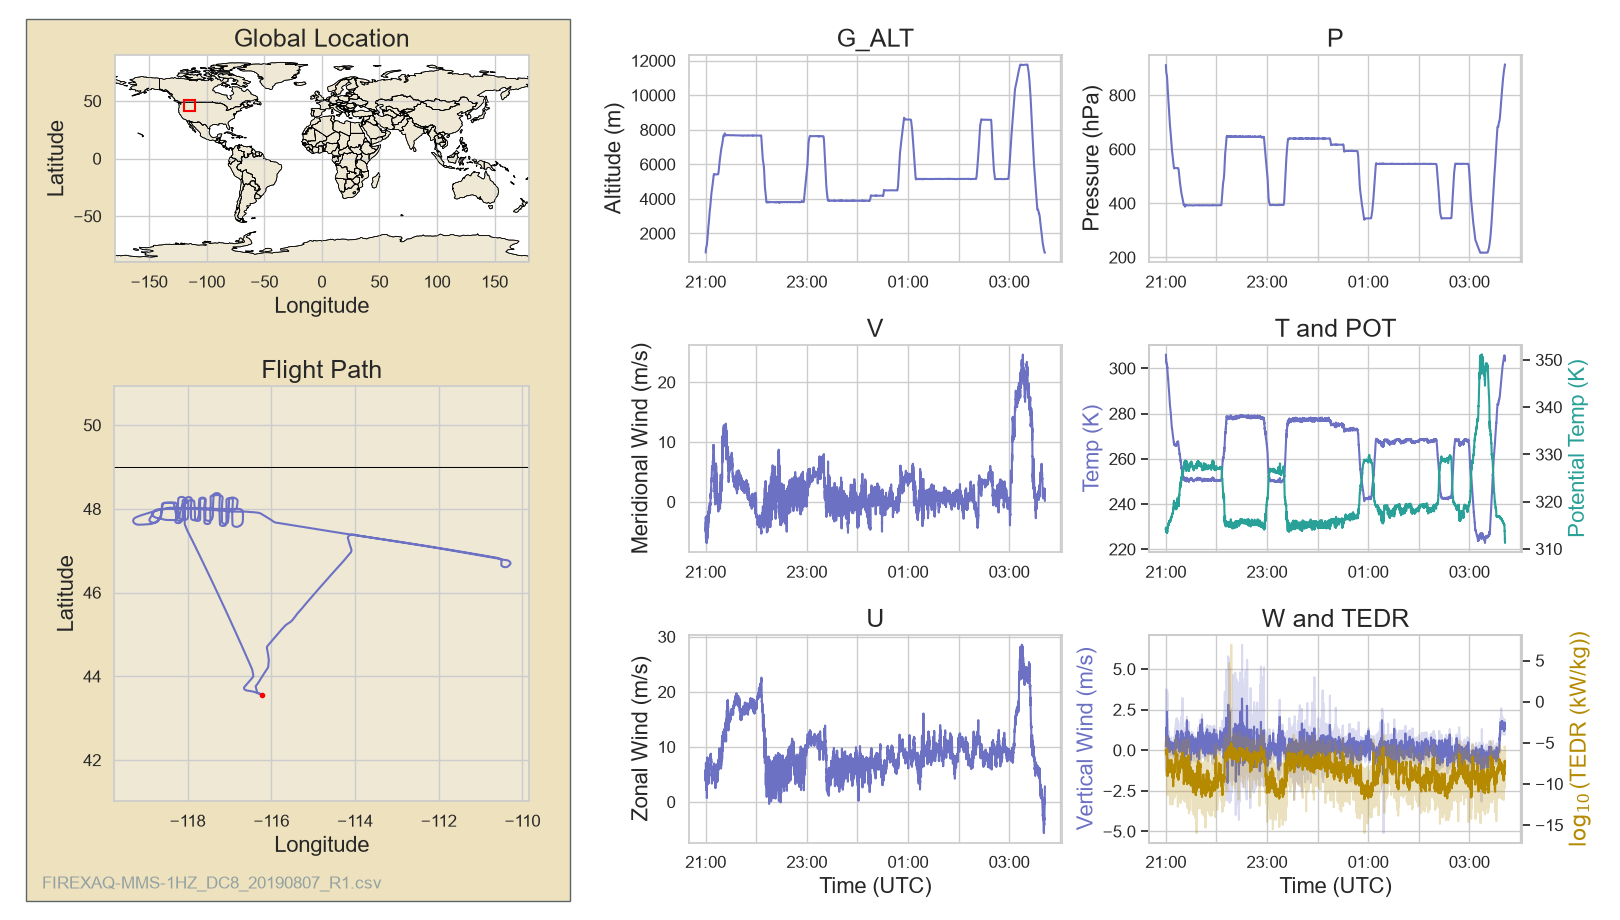
August 7, 2019 Flight:
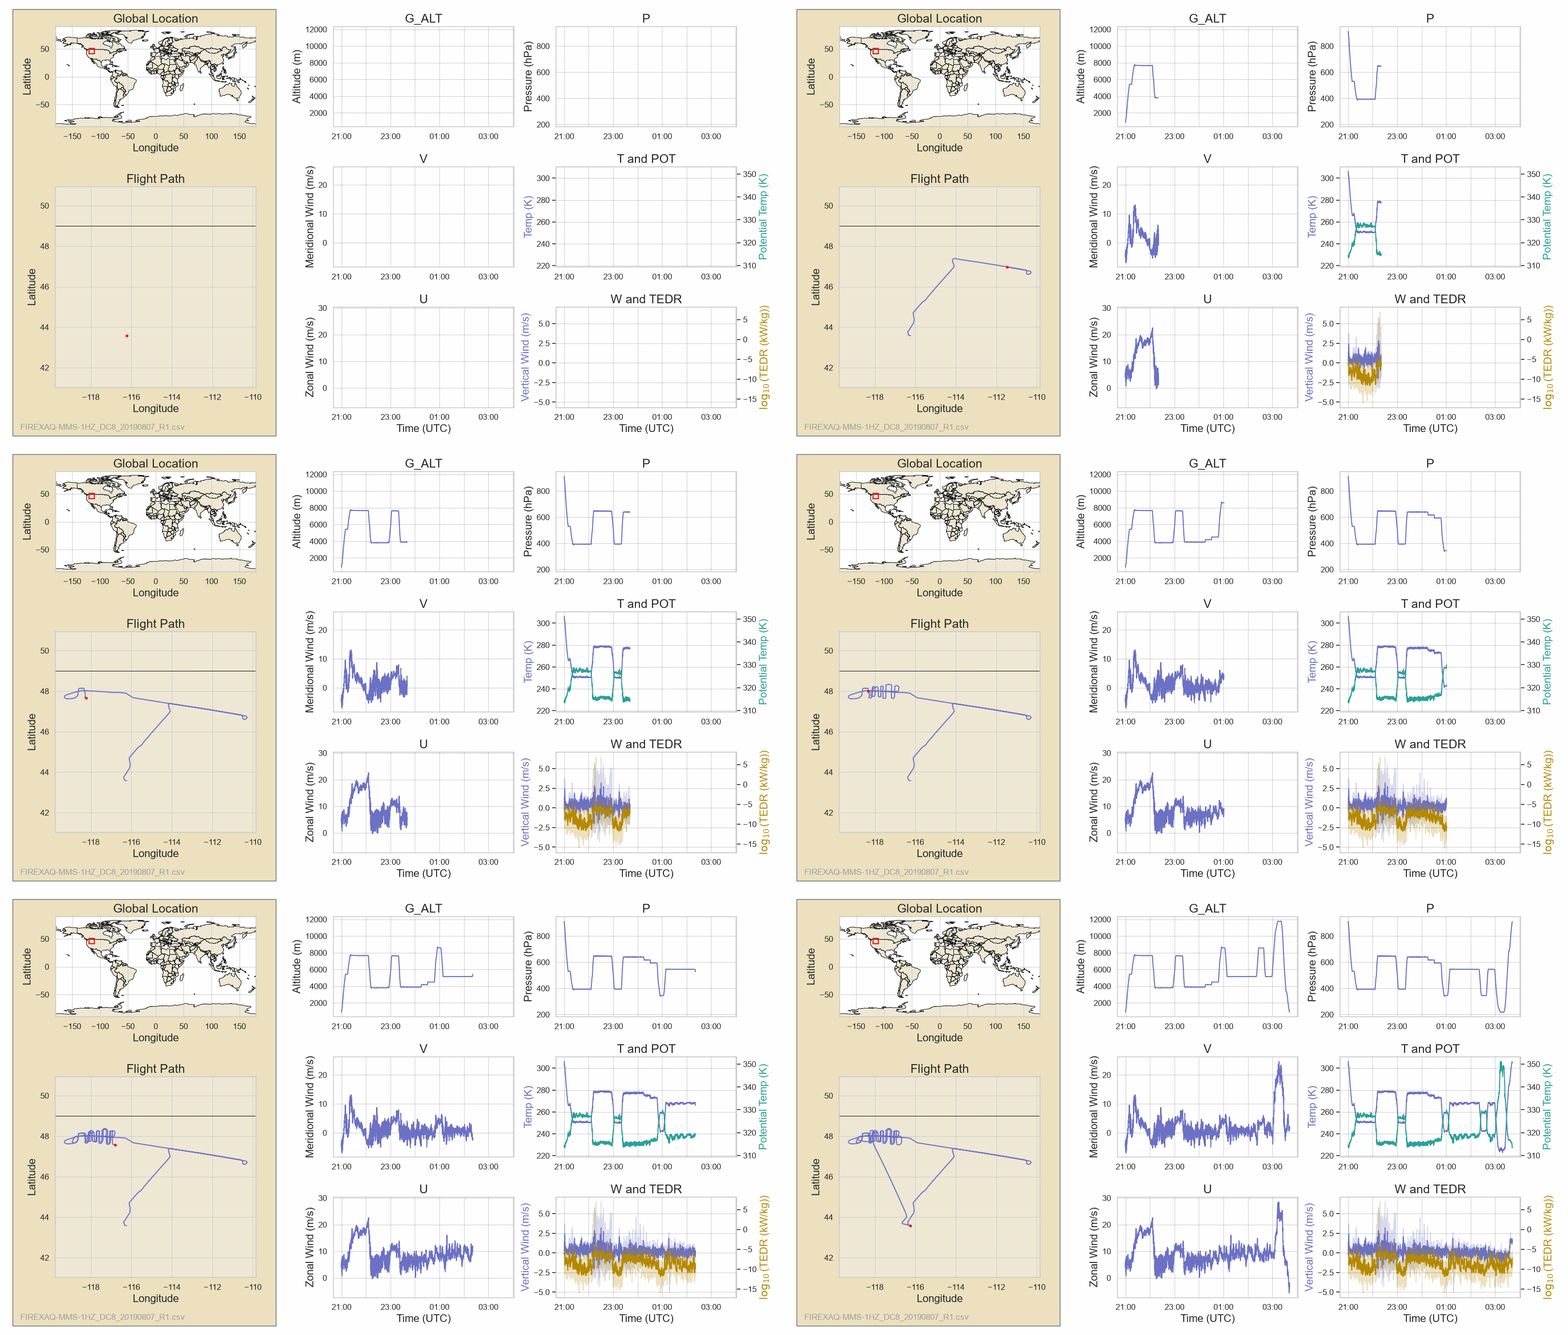
Full Dashboard
Science example: Downwind CO and Ozone Variability with Fire Plume Age
Initial flight tests in older smoke showed lower CO and ozone levels compared to fresh smoke. In fresh smoke, CO levels dropped as the plume diluted and fire emissions changed. Active chemical reactions were clear, with ozone temporarily destroyed near the fire but building up along the edges downwind.
|
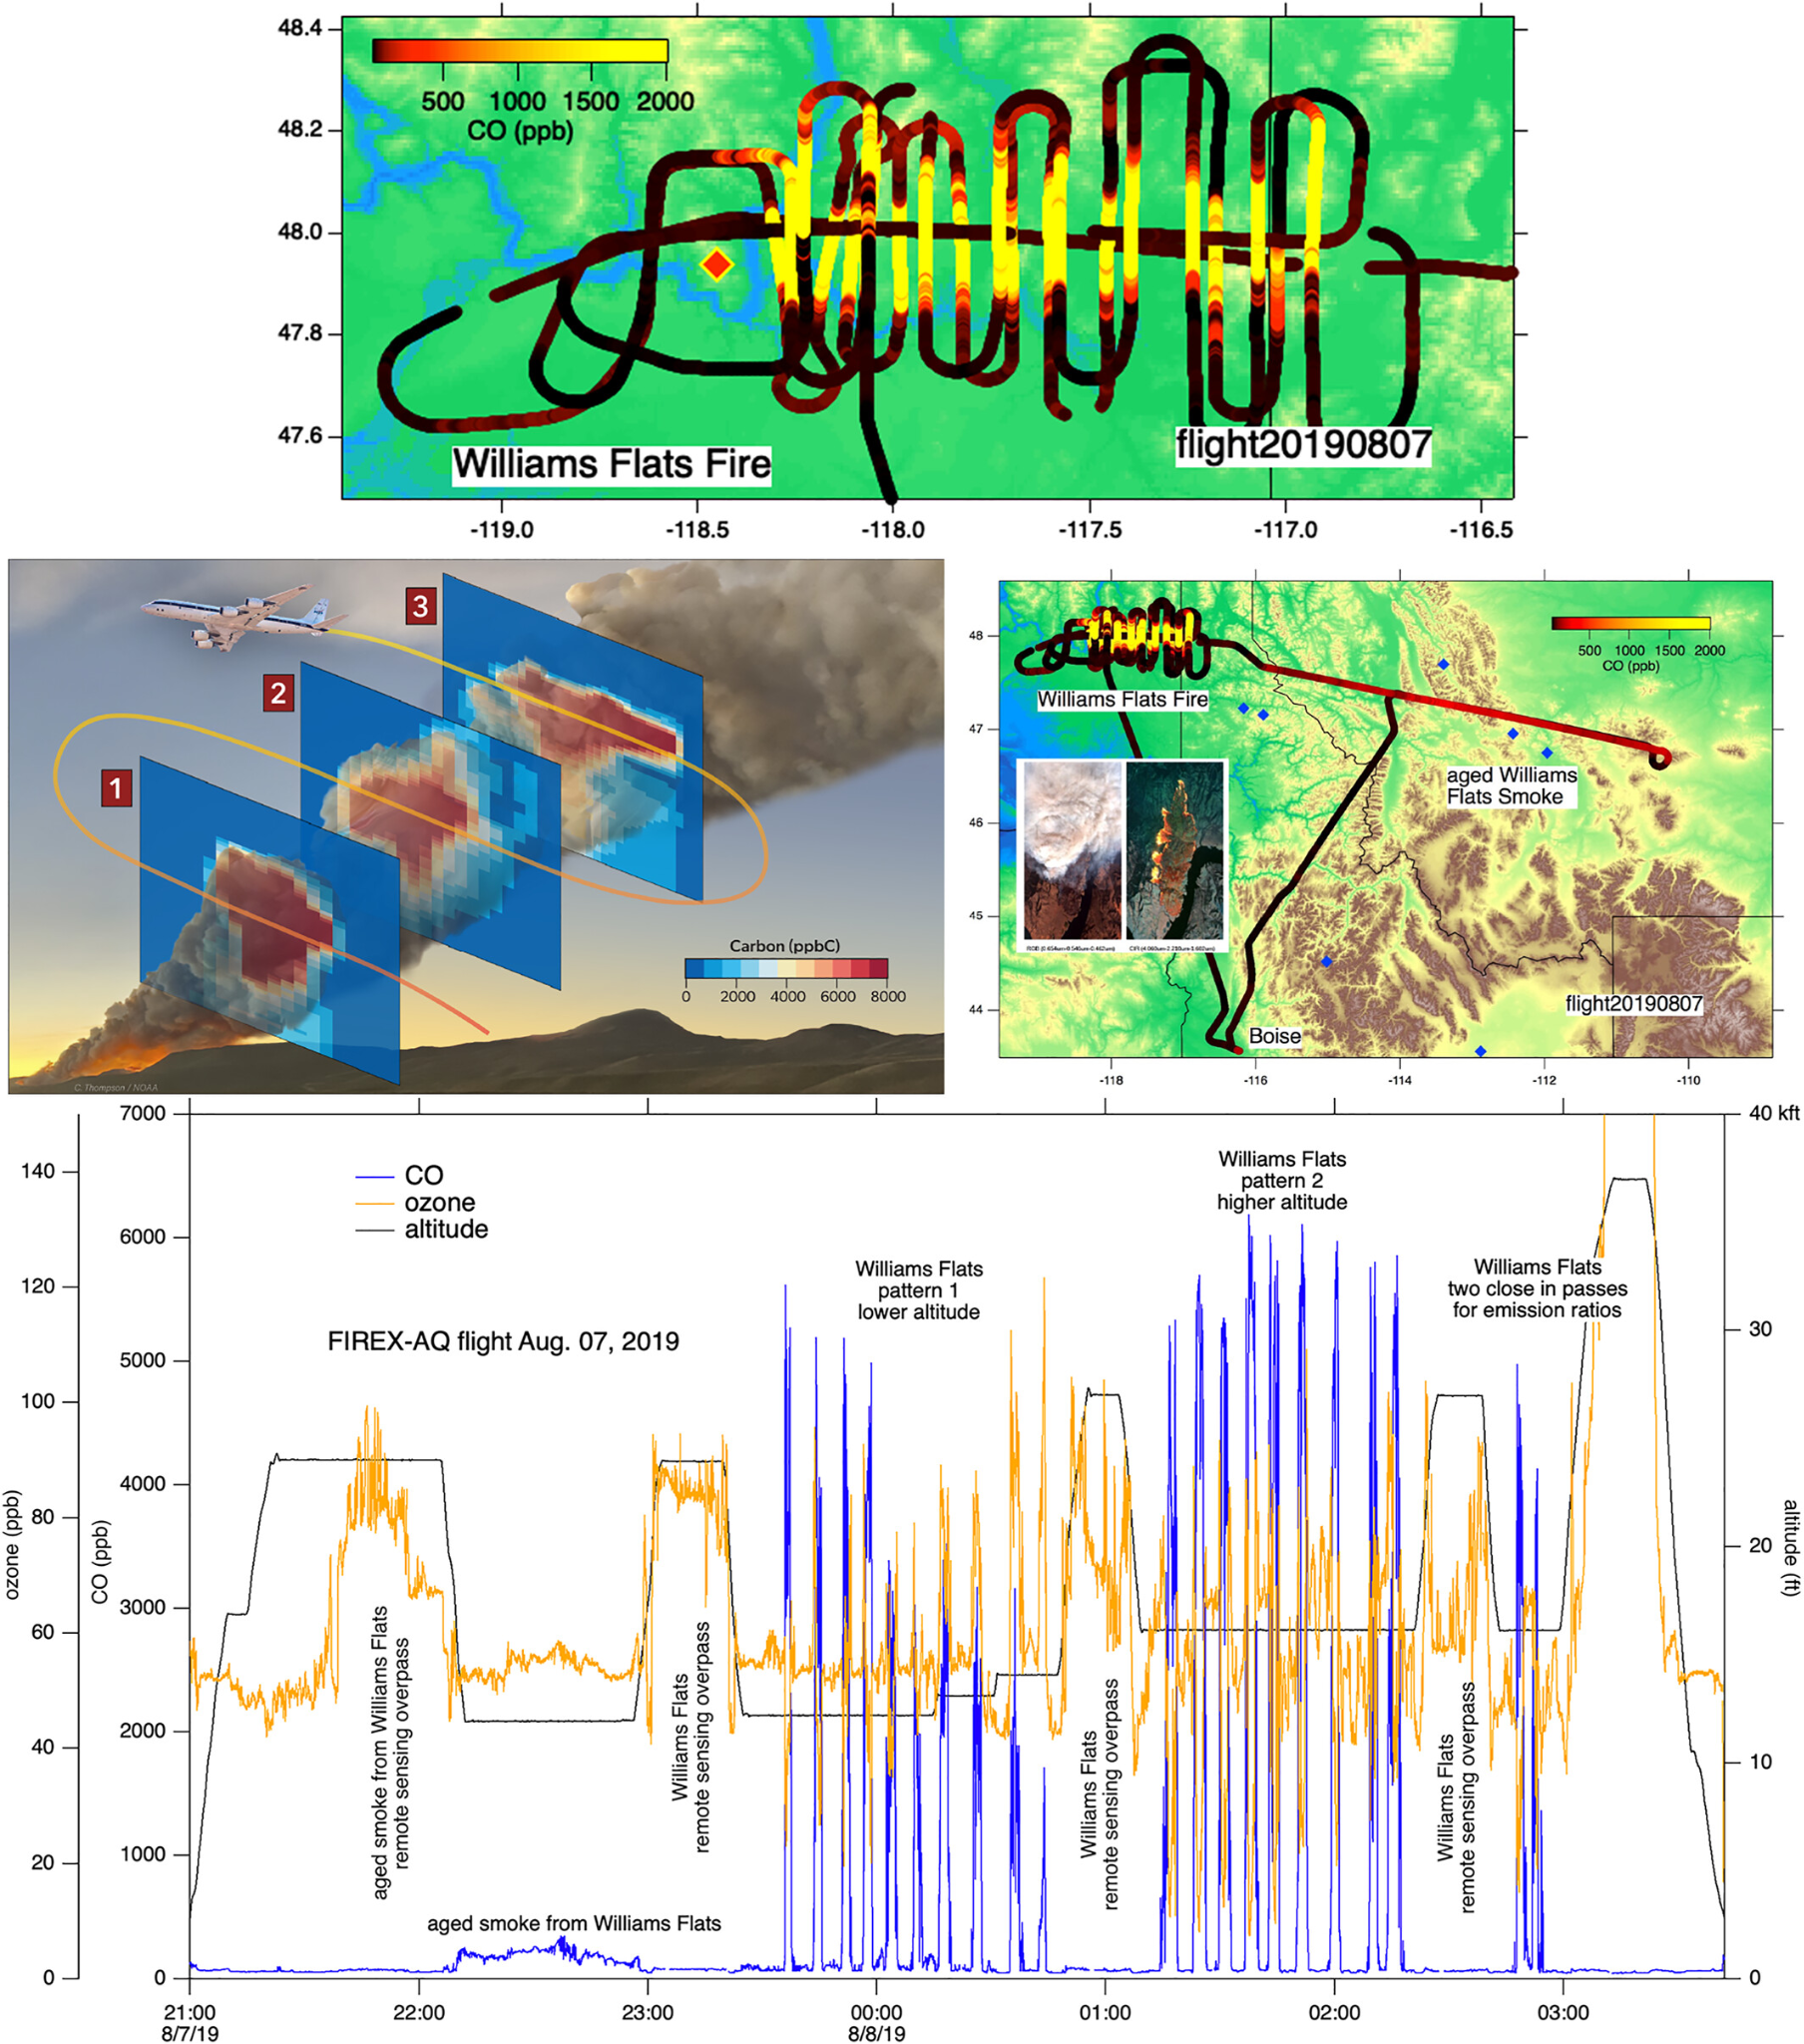
Figure: (top left) The carbon flux for several plume crossings computed from the carbon to aerosol backscatter measured by the HSRL LIDAR as calculated. (top right) Regional overview of the flight plan including sampling aged smoke. The insert shows data from the MASTER instrument of the fire in the visible and IR. (bottom) The time series of CO and ozone together with the flight altitude [Figure Credit: Warneke et al., 2023].
Project Goal
To understand the trace gas and aerosol emissions characteristics from wildfires and prescribed fires.
Aircraft
DC-8
Role of MMS
To provide meteorological data to better understand dynamically and thermodynamically driven fire processes, pollution transport, and their impacts.
Reference:
Warneke, C., Schwarz, J. P., Dibb, J., Kalashnikova, O., Frost, G., Al-Saad, J., et al. (2023). Fire influence on regional to global environments and air quality (FIREX-AQ). Journal of Geophysical Research: Atmospheres, 128, e2022JD037758. https://doi.org/10.1029/2022JD037758
DCOTSS 2022 (Dynamics and Chemistry of the Summer Stratosphere)
Description
A NASA Earth Venture Suborbital research project (2019 - 2025) to investigate the impacts of intense thunderstorms over the U.S. on the summertime stratosphere. During summer, powerful convective storms within the North American Monsoon Anticyclone reach deep into the lower stratosphere, creating unique atmospheric conditions such as elevated water vapor levels. Because the chemical and dynamical impacts of this deep convection on regional and global stratospheric air remain poorly understood, the Dynamics and Chemistry of the Summer Stratosphere (DCOTSS) project directly investigates these processes to bridge the knowledge gap.
May 31, 2022 Flight:
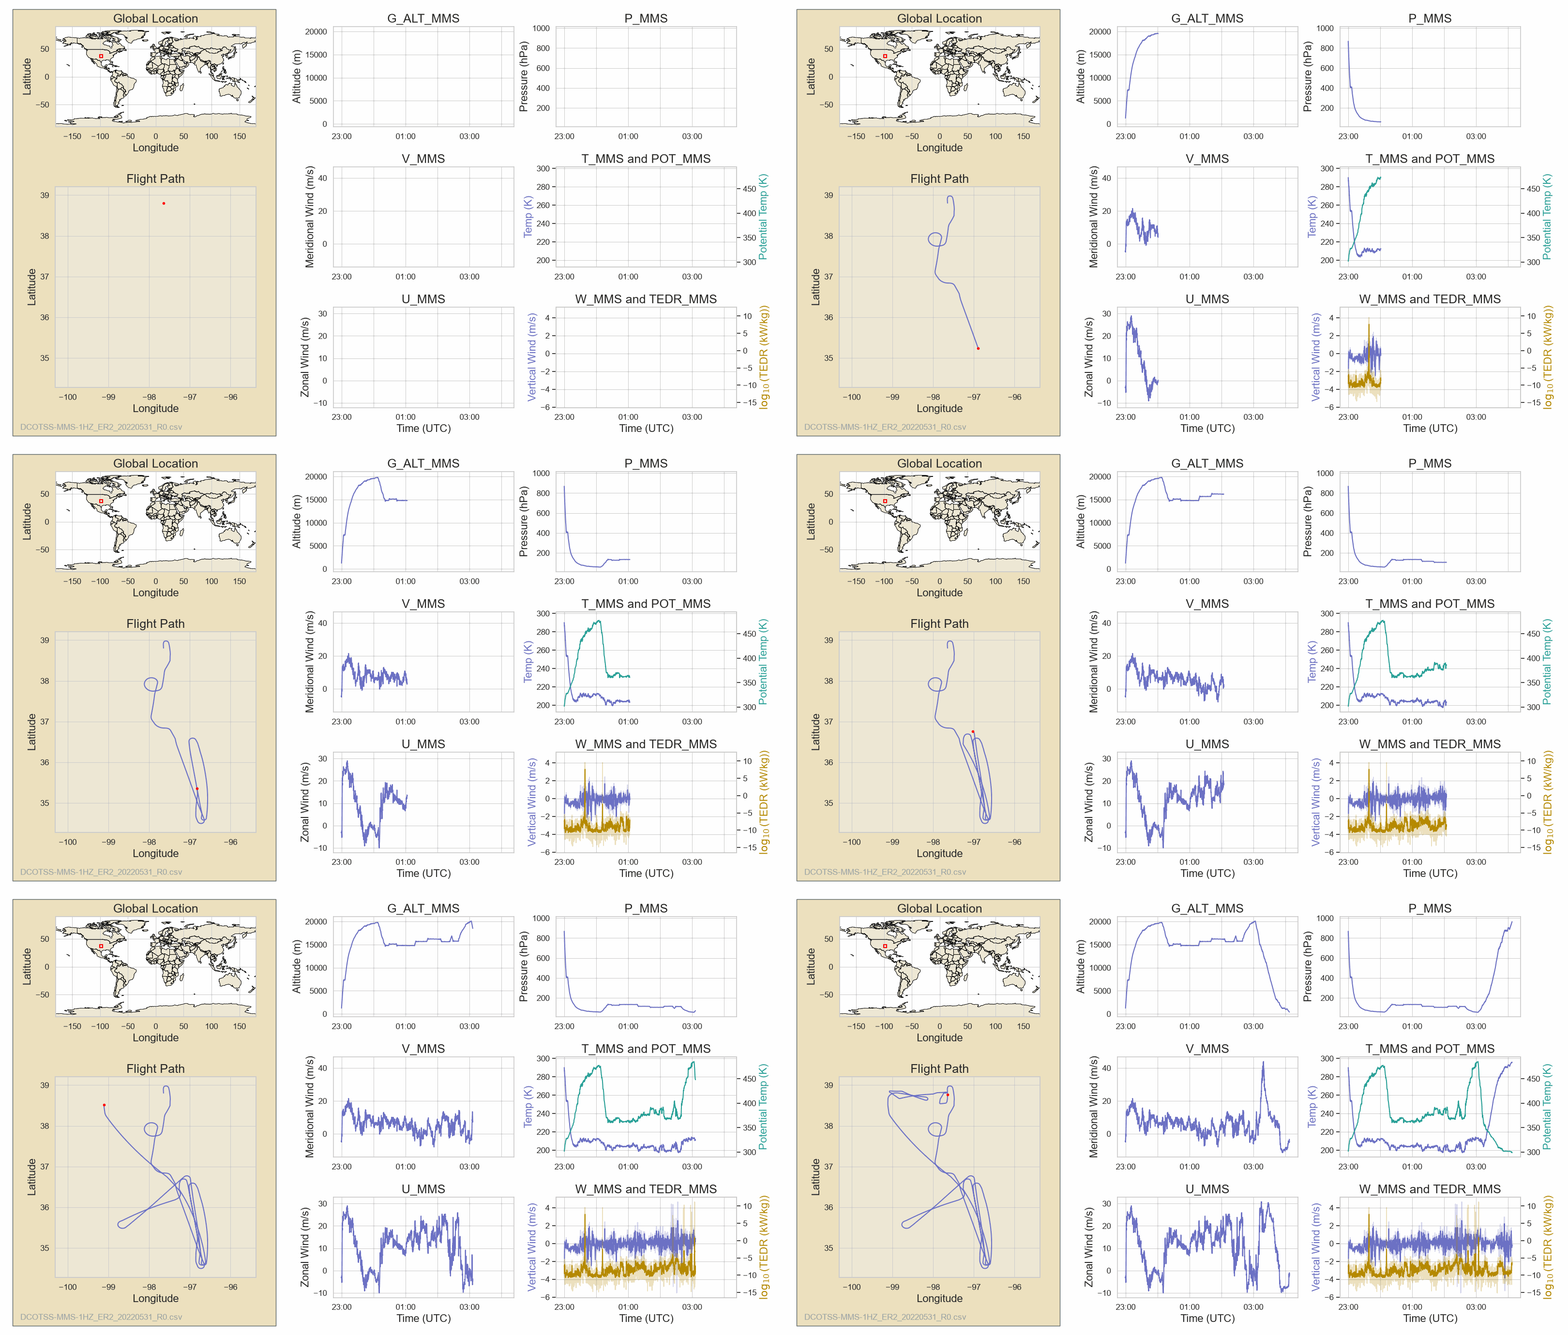
Full Dashboard
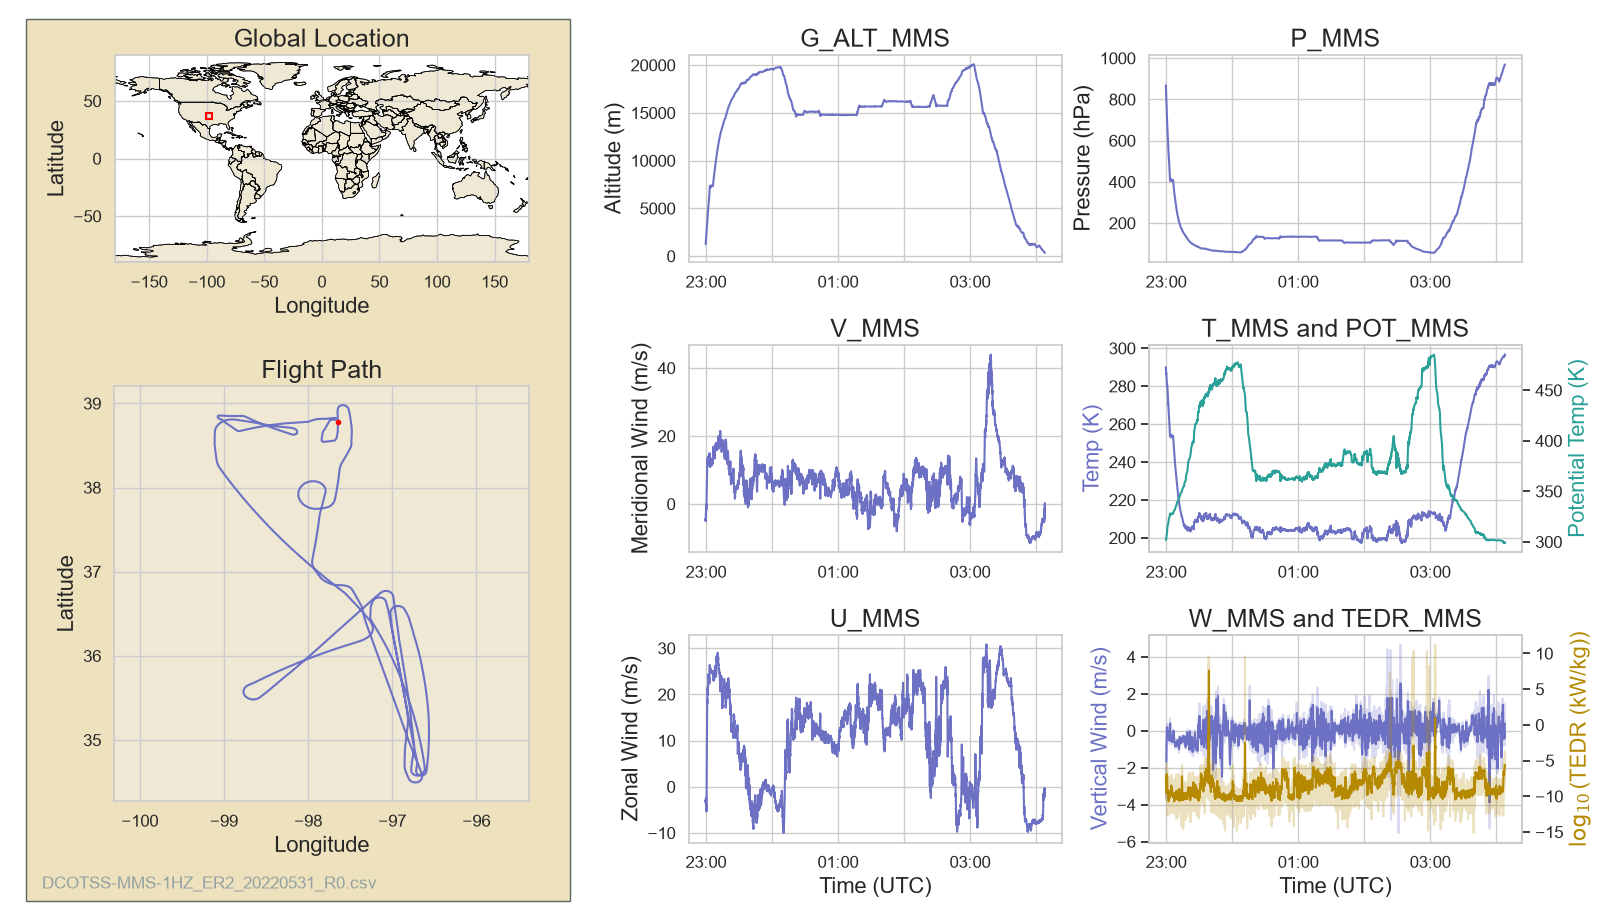
Science example 1): 3D wind, Temperature, and Atmospheric Turbulence observed using MMS (MMS GPS location, Temp, & vertical wind, Turbulent Kinetic Energy)
|
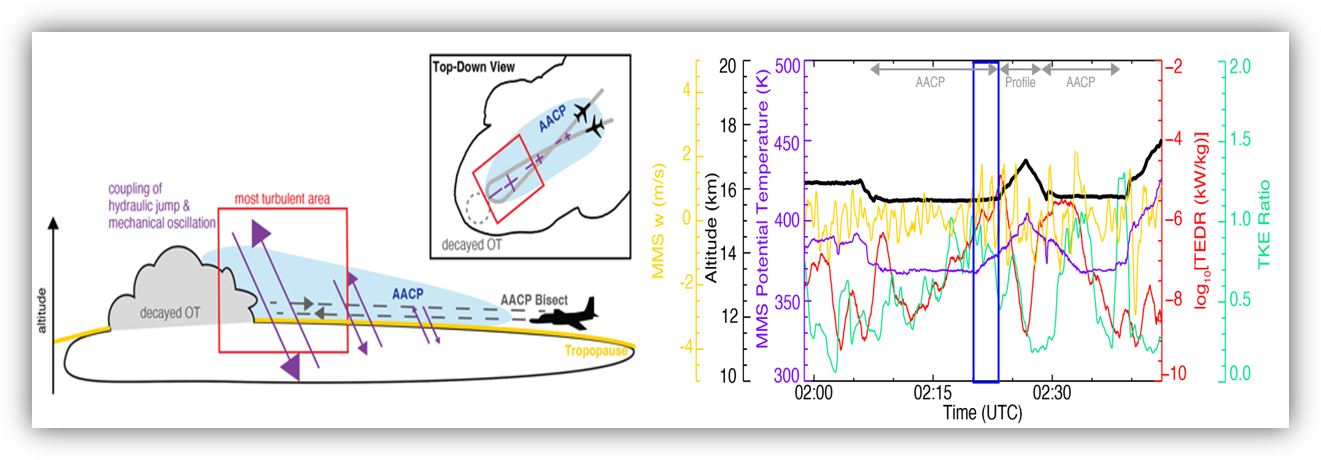
Figure: (Left) An illustration of above-anvil cirrus plumes (AACPs) sampling during the 31 May 2022 flight. (Right) MMS measurements of the vertical wind speed, the log10 of turbulent eddy dissipation rate (TEDR), and the vertical-to-horizontal turbulence kinetic energy (TKE) ratio [Figure credit: Gordon et al., 2024].
Project Goal
To sample active overshooting convection and above-anvil cirrus clouds, and to characterize their dynamical behavior during the 2022 DCOTSS campaign.
Aircraft
ER-2
Role of MMS
To provide 3D wind, turbulence metrics, and overshooting convective process and its outflow characteristics, and to link them to gas and aerosol-phase pollutant transport.
June 24, 2022 Flight:
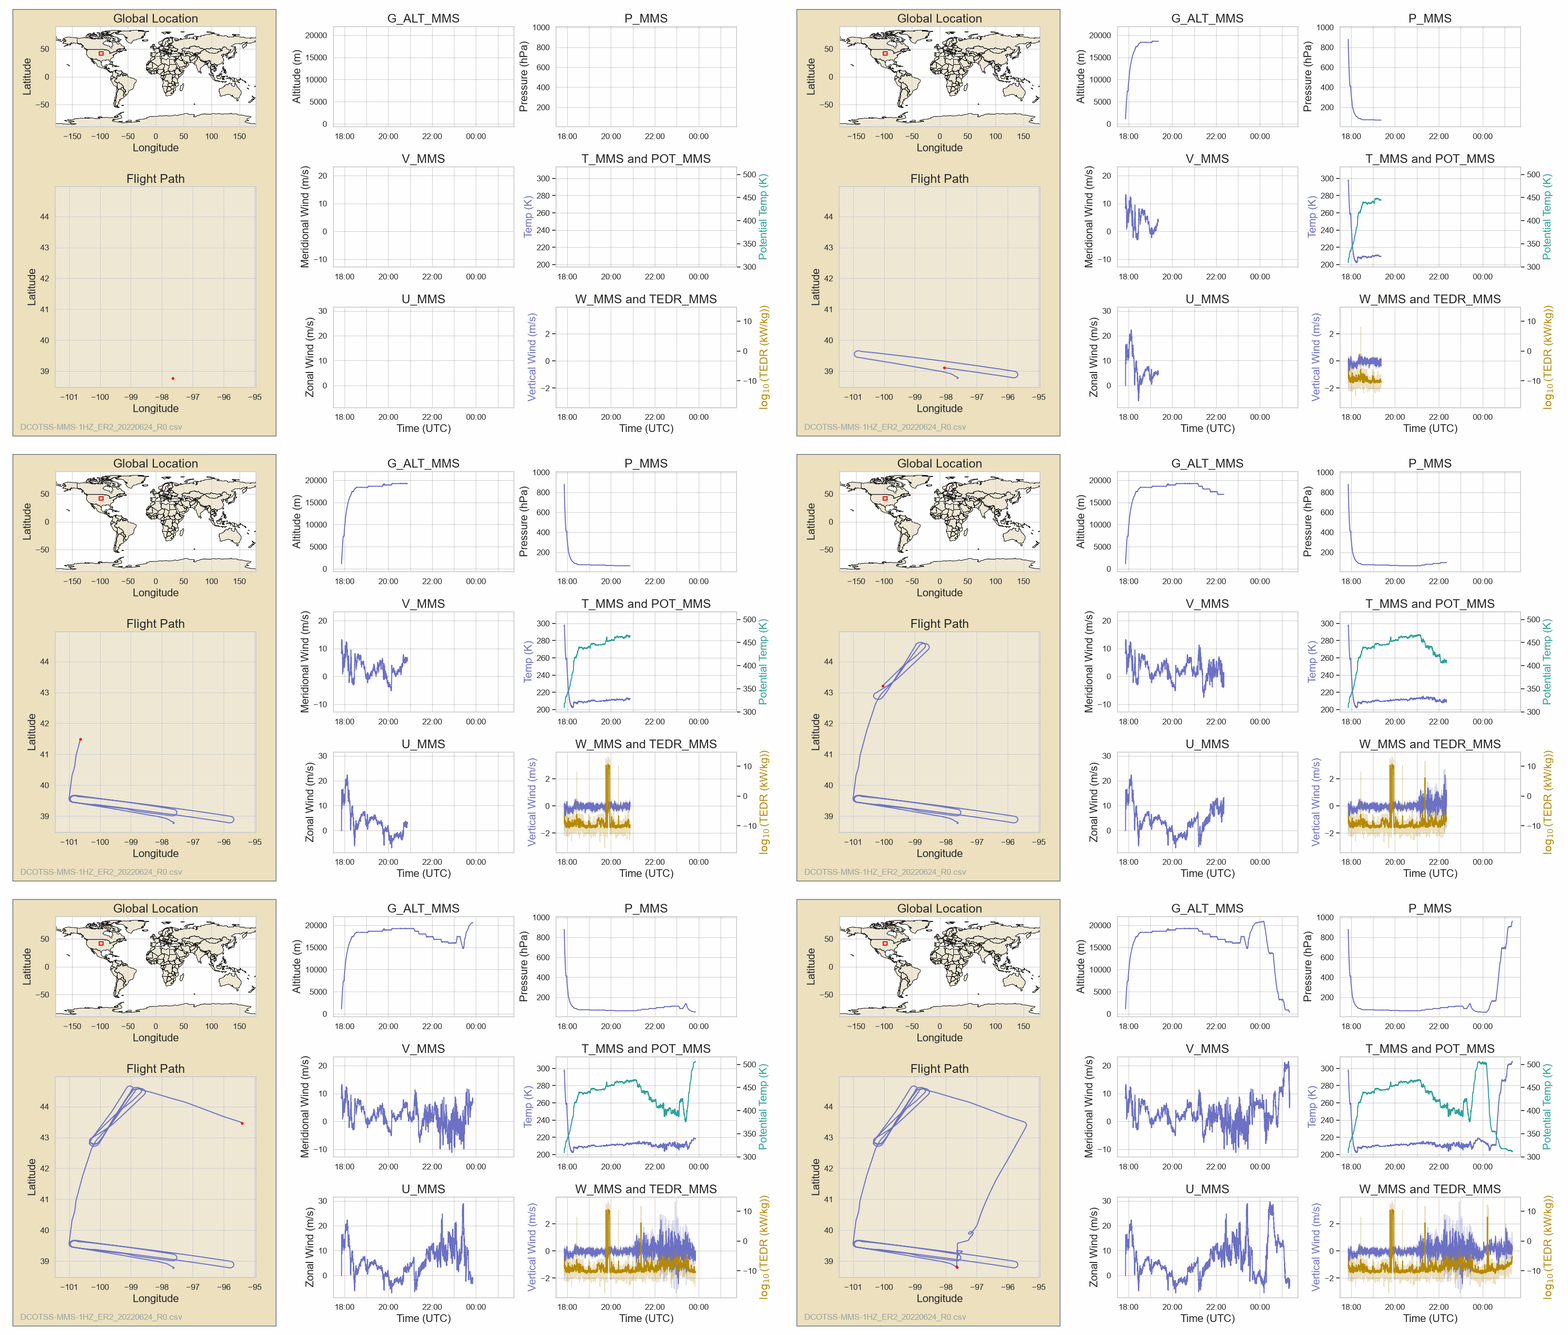
Full Dashboard
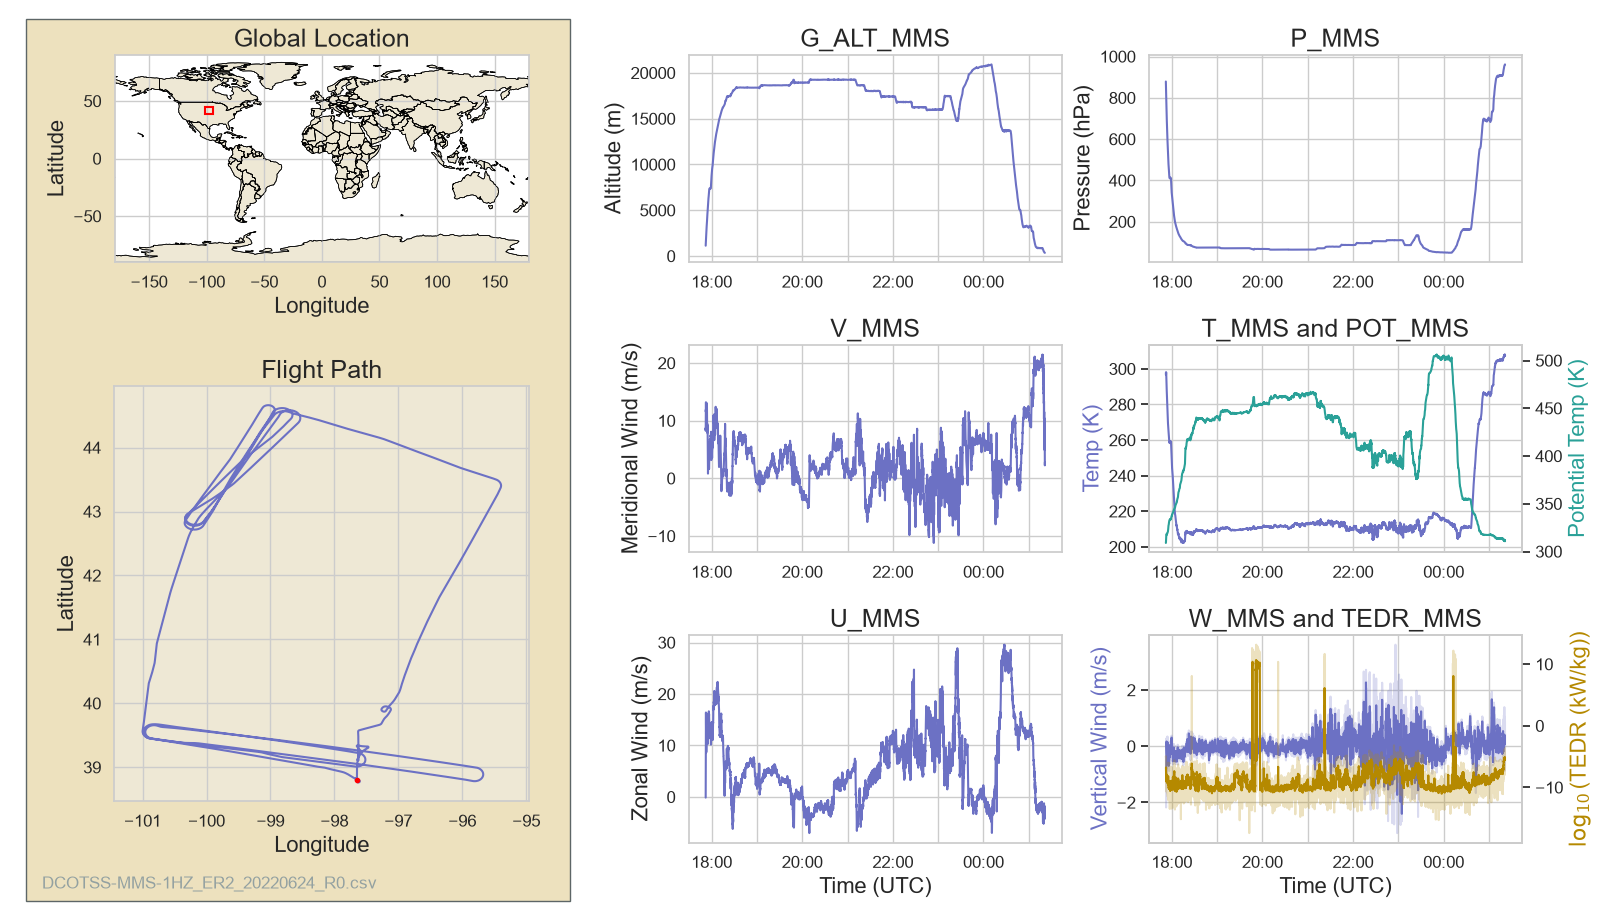
Science example 2): Atmospheric rivers and its linkage to overshooting convection and its role in the UTLS water vapor distribution using May 31, 2022, June 24, 2022 and other cases.
|
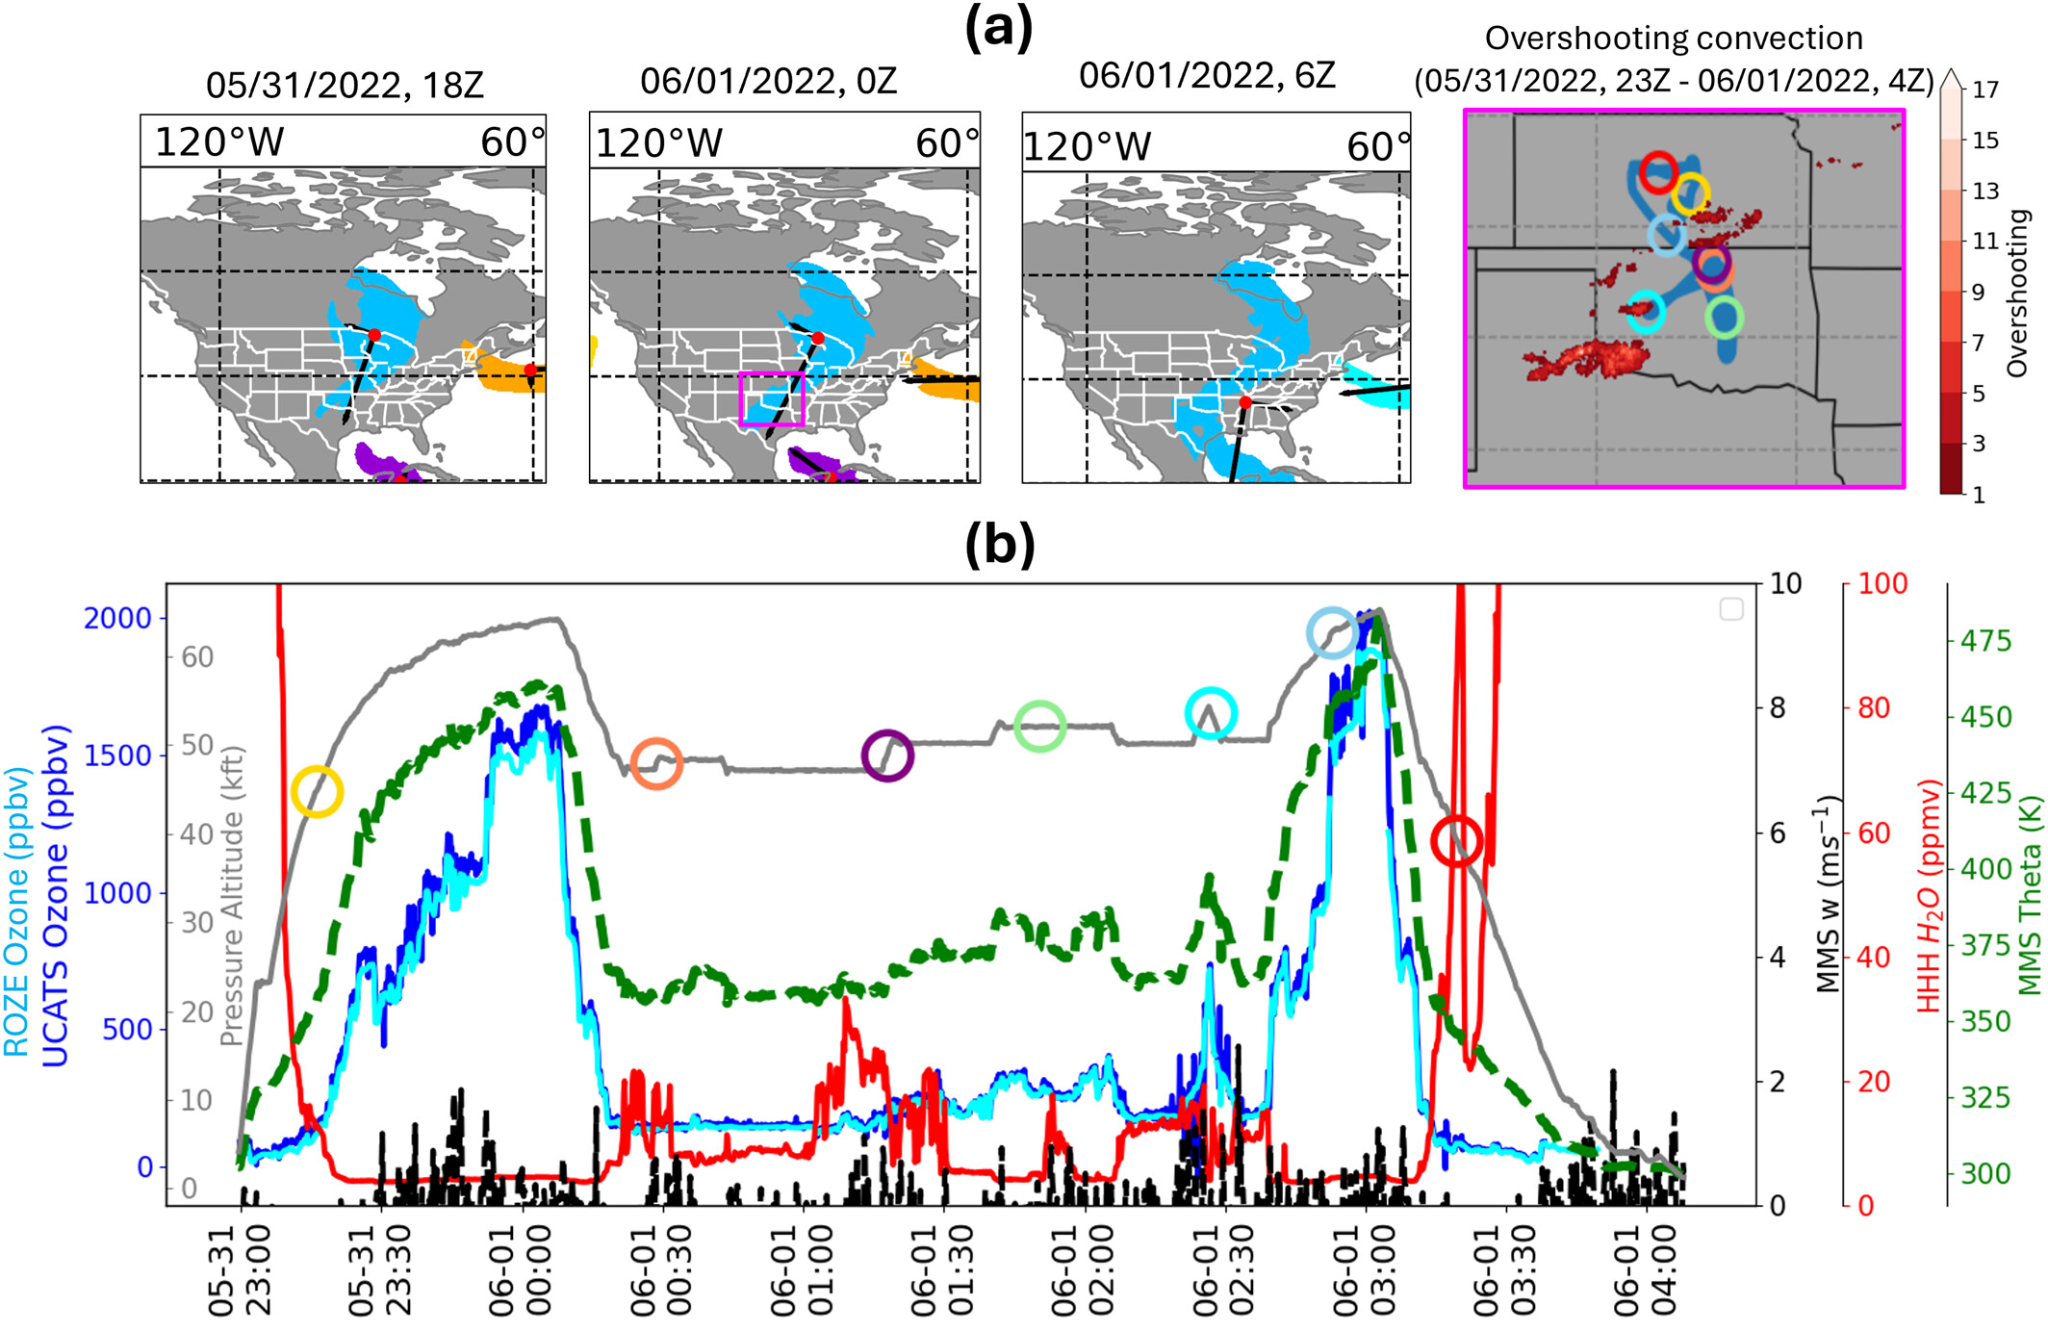
Figure: Evolution of AR characteristics and DCOTSS measurements during the overshooting event from 23Z on May 31 to 4Z on 1 June 2022 (detected by GridRad >10 dBZ data for illustration). (a) The ARs (color shading) detected in coincidence with GridRad-based overshooting convection events (red dots in the map). (b) The time series of DCOTSS in situ measurements, including Ozone (blue, UCATS; cyan, ROZE; ppbv), Potential Temperature (theta, θ) (green, MMS; K), water vapor (H2O) (red, HHH; ppmv), and vertical wind (w) (black, MMS; m s−1), and pressure altitude (grey, MMS; kft). Colored circles along the flight track in panel (a) correspond to the specific timestamps shown in the time series in panel (b) [Figure credit: Ryoo et al., 2026].
Project Goal
In terms of MMS data, the project’s goal is to use high-resolution in situ dynamical and thermodynamic measurements—temperature, pressure, 3D winds, and potential temperature - to contrast the vertical moisture structure and mass flux of AR-driven versus non-AR overshooting convection. Specifically, MMS data provides the isentropic coordinates to distinguish broad AR water vapor enhancements confined near the tropopause (315–380 K) from narrower non-AR plumes penetrating deeper into the stratosphere (380–420 K), while resolving the distinct synoptic wind fields and inflow pathways driving each regime.
Reference:
Gordon, A. E., Homeyer, C. R., Smith, J. B., Ueyama, R., Dean-Day, J. M., Atlas, E. L., Smith, K., Pittman, J. V., Sayres, D. S., Wilmouth, D. M., Pandey, A., St. Clair, J. M., Hanisco, T. F., Hare, J., Hannun, R. A., Wofsy, S., Daube, B. C., and Donnelly, S.: Airborne observations of upper troposphere and lower stratosphere composition change in active convection producing above-anvil cirrus plumes, Atmos. Chem. Phys., 24, 7591–7608, https://doi.org/10.5194/acp-24-7591-2024.
Ryoo, J.-M., Bowman, K., Ueyama, R., Liu, C., Homeyer, C. R., Smith, J., et al. (2026). Linkage between atmospheric rivers and overshooting convection and their roles on UTLS water vapor during the North American Monsoon: Insight from DCOTSS. Journal of Geophysical Research: Atmospheres, 131, e2025JD046298. https://doi.org/10.1029/2025JD046298
ACCLIP 2022 (Asian Summer Monsoon Chemical & CLimate Impact Project)
Description
ACCLIP is a jointly funded two-month campaign in Summer 2022* in the Republic of Korea. Two aircraft (the NASA WB-57 and the NCAR G-V), outfitted with state-of-the-art sensors. To evaluate ASM transport pathways, water vapor distribution, and chemical processing into the UTLS, the project will also characterize ASM aerosol populations to determine their overall impact on stratospheric ozone, radiative forcing, and global climate.
August 6, 2022 Flight:
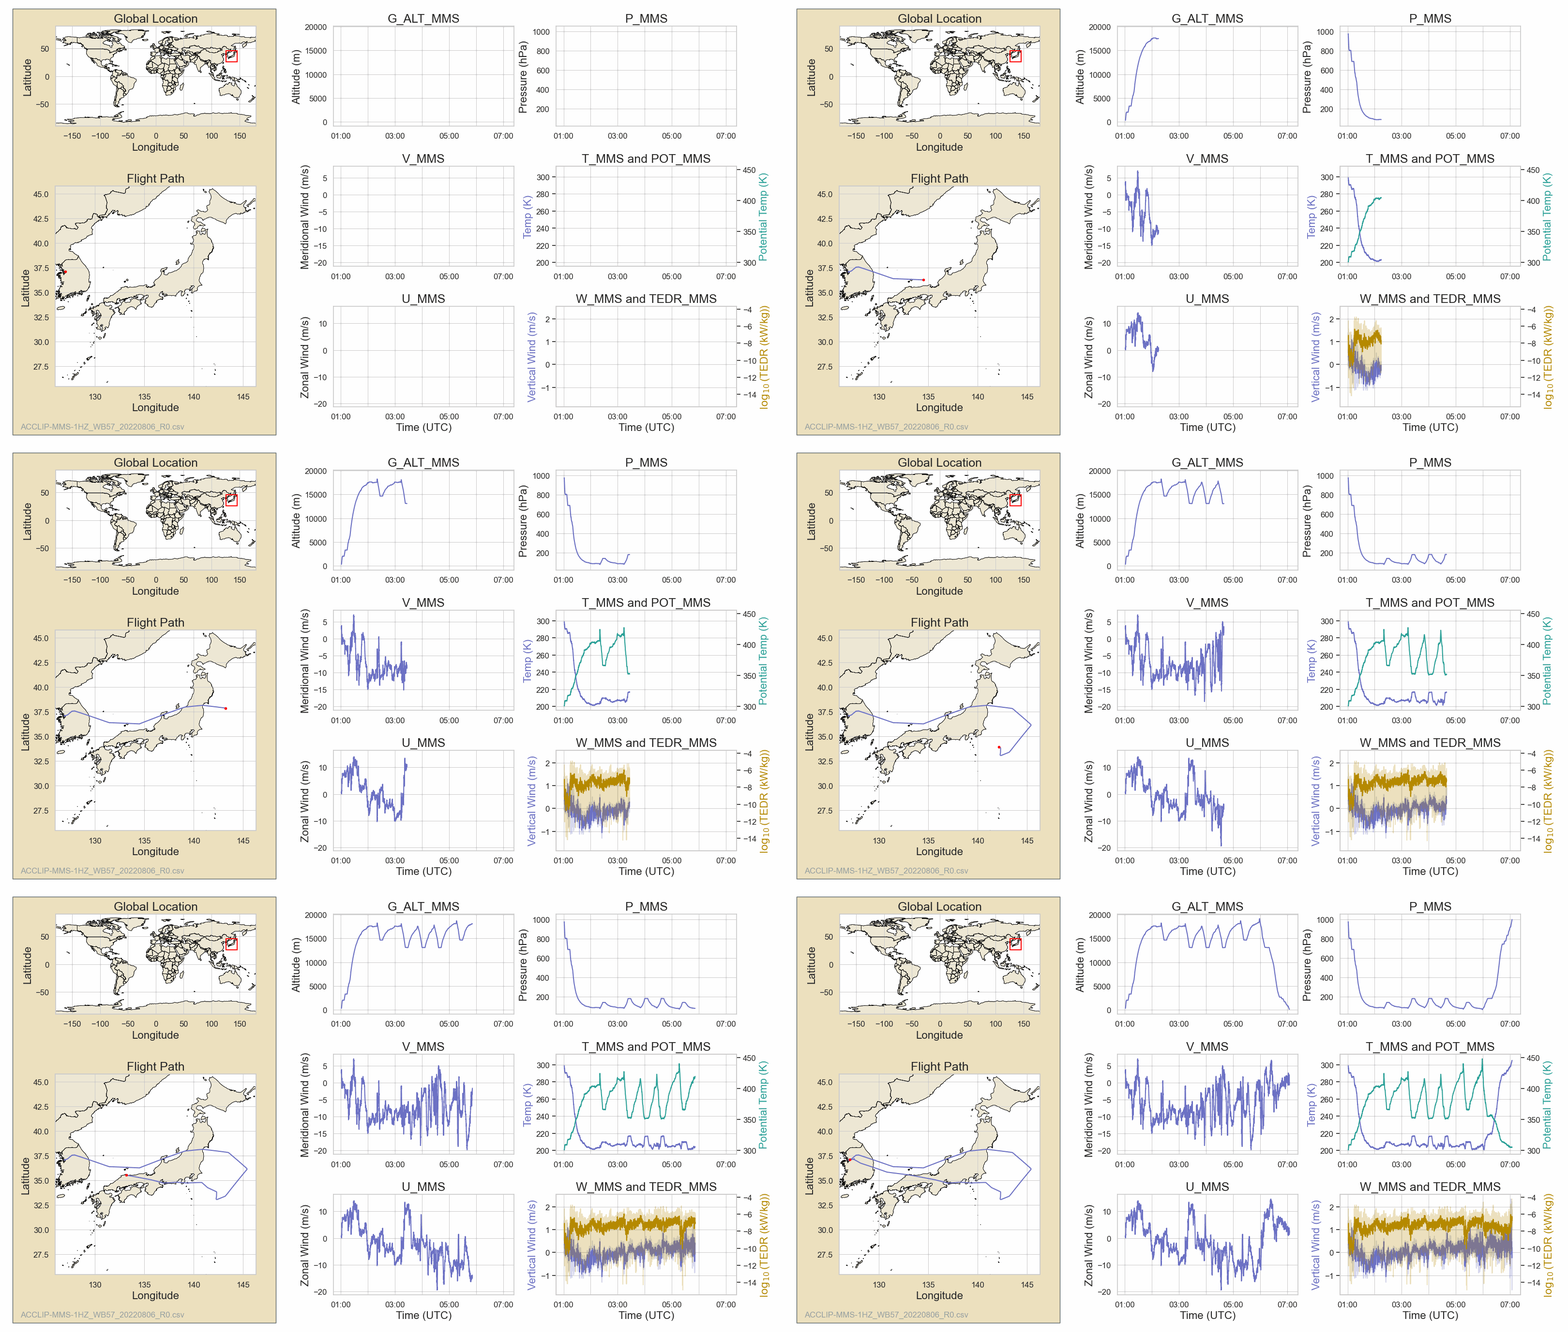
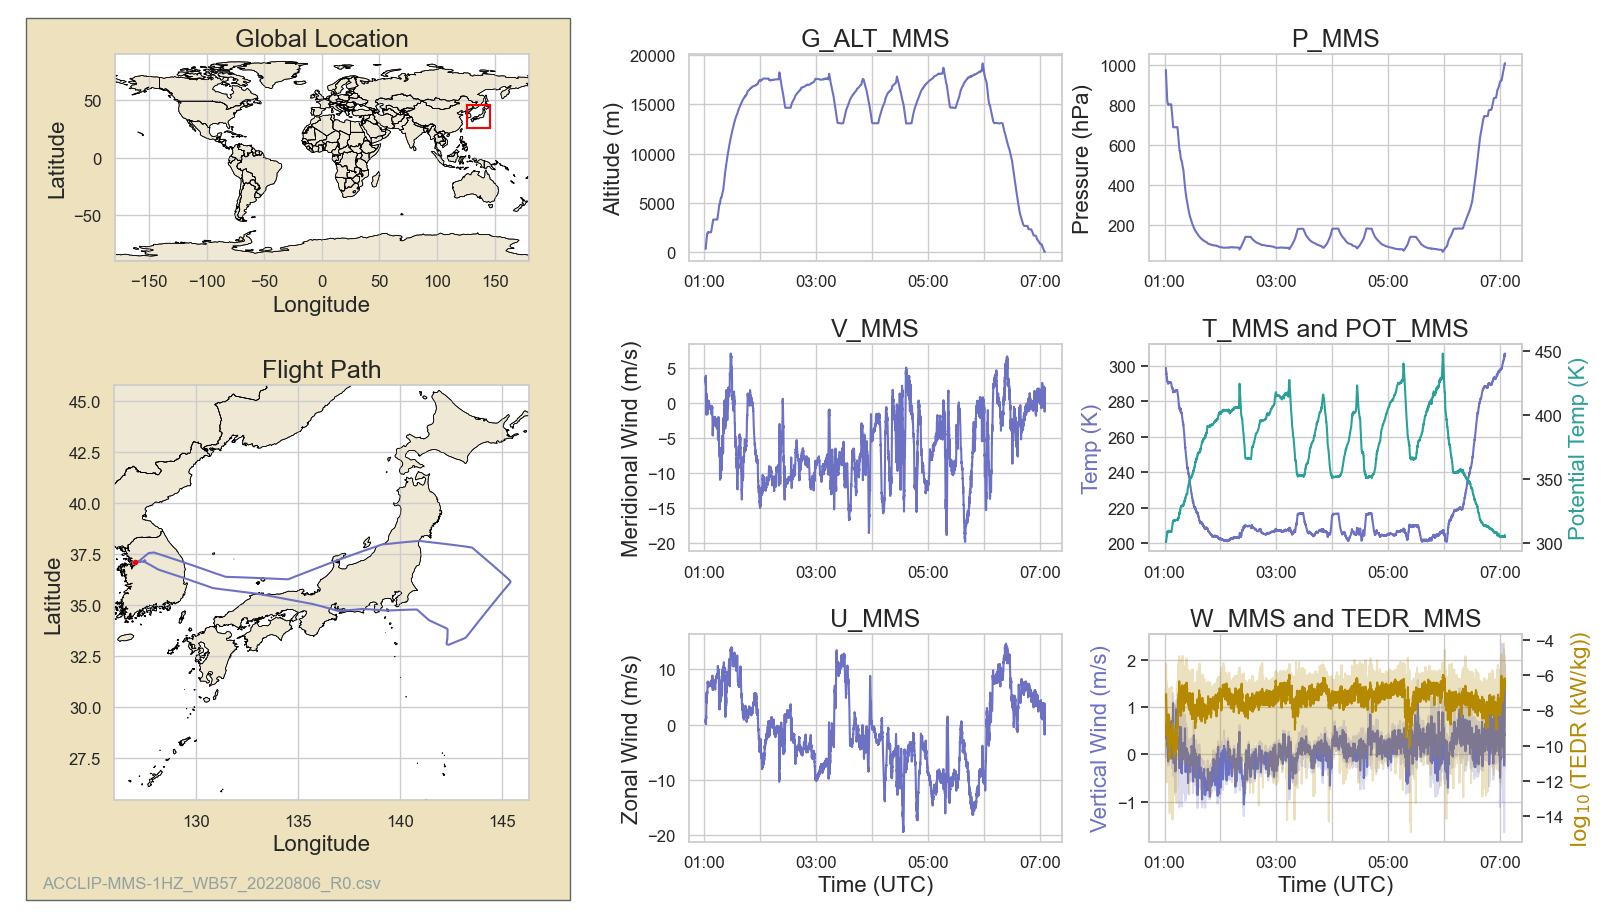
Full Dashboard
Science example: Ozone profile retrievals from TROPOMI (TROPOspheric Monitoring Instrument) backscattered ultraviolet measurements during the ACCLIP using August 6, 2022 case.
|
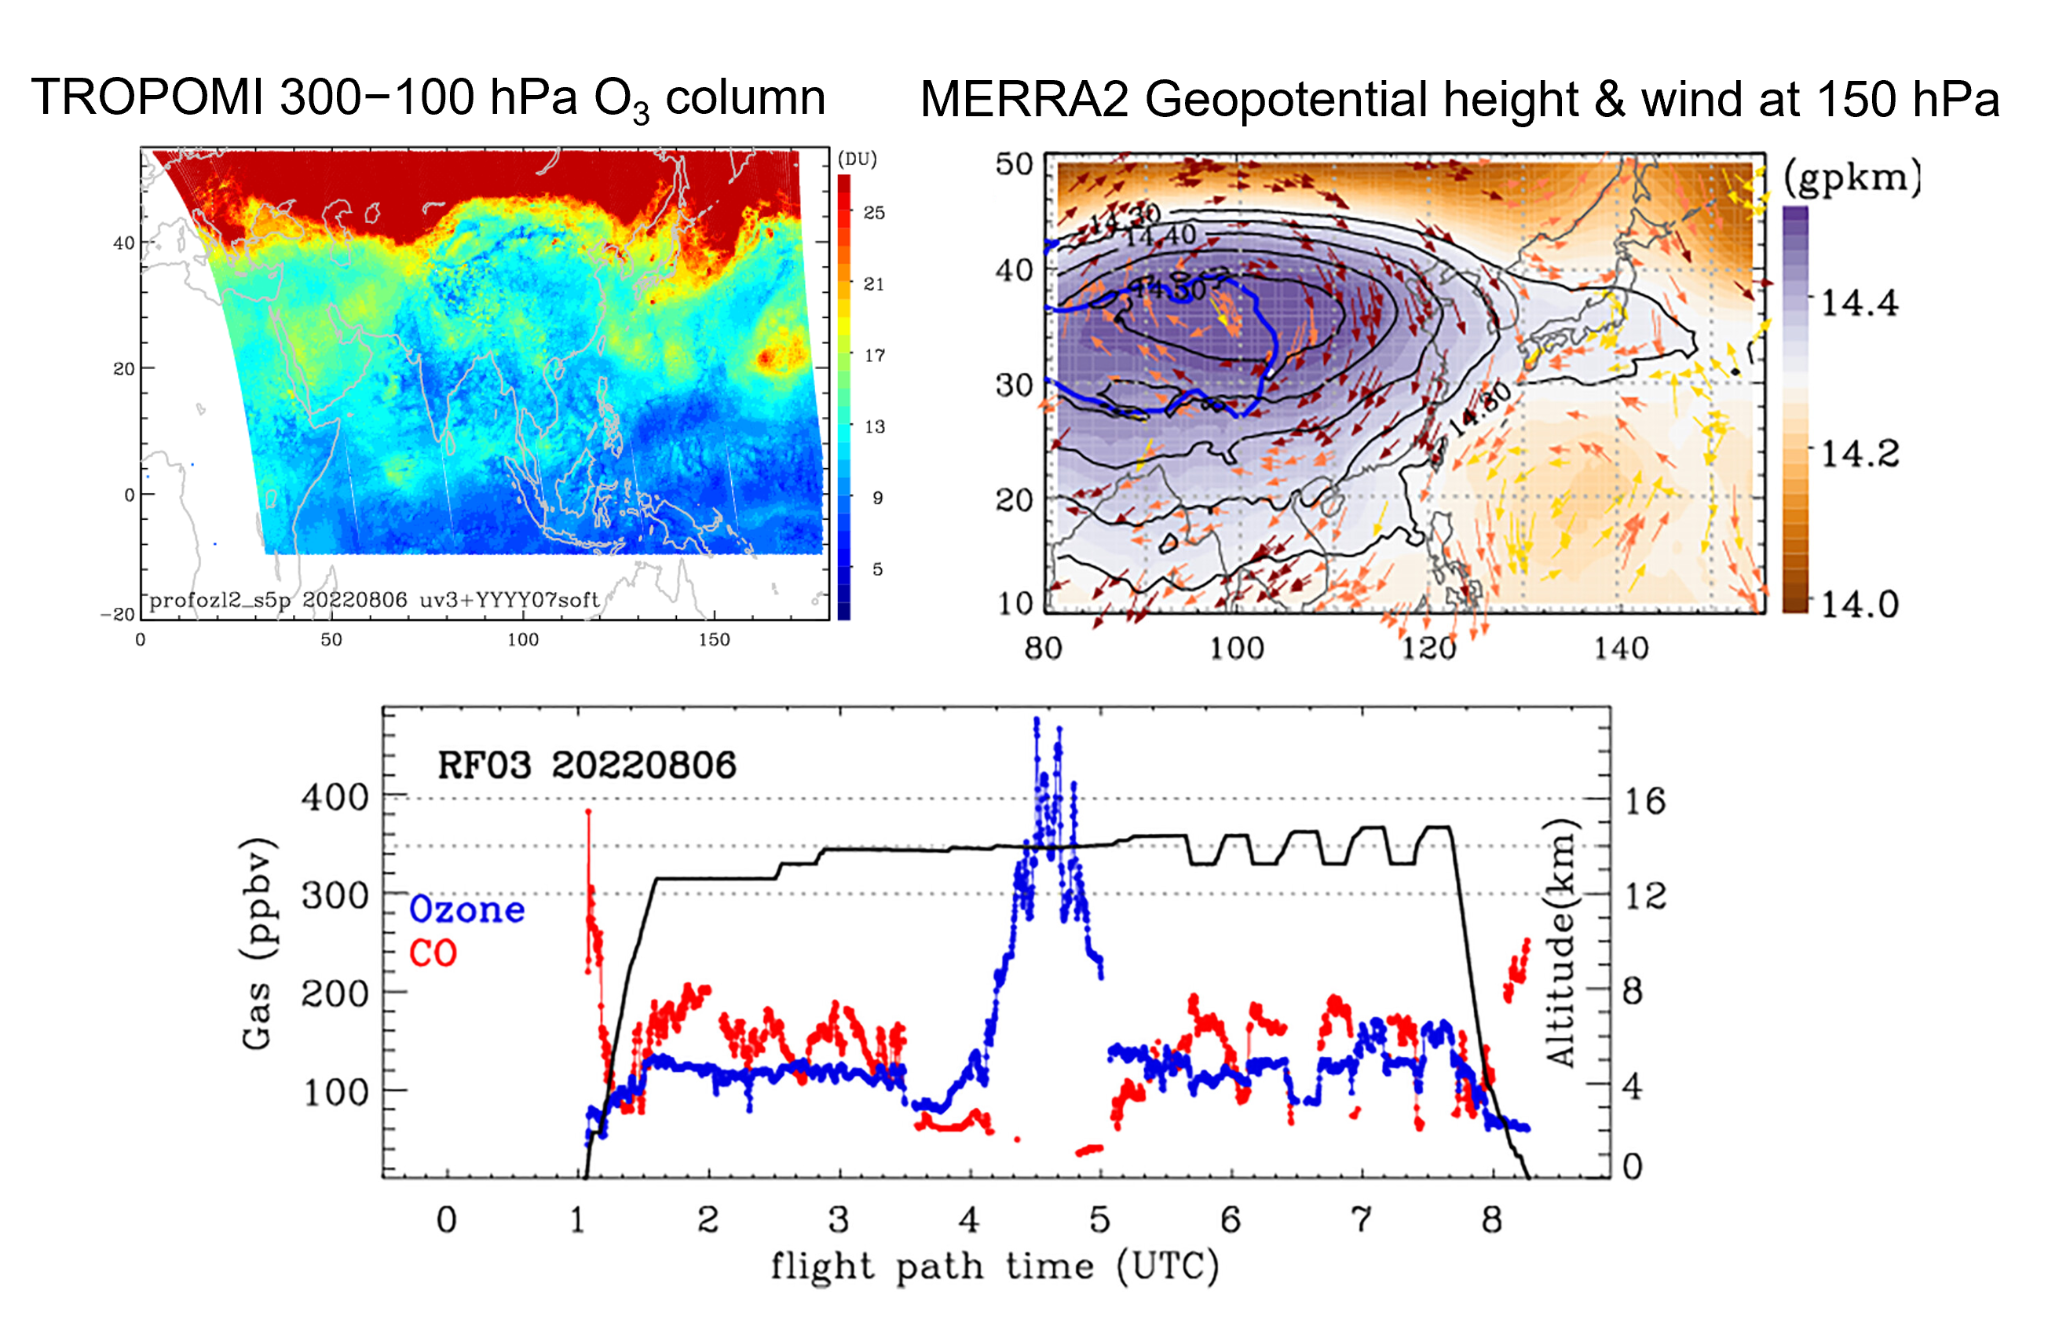
Figure. (left) TROPOMI 300−100 hPa O3 column (right) MERRA2 Wind speed (shaded) and wind direction (vector) at 150 hPa. Geopotential height (GPH) contours are overlaid on August 6, 2022. The blue line represents the 3,000 m altitude of the Tibetan Plateau. (bottom) Mixing ratios of O3 (blue) and CO (red) and the altitude (black) measured by the GV aircraft on August 6, 2022. The mixing ratios are plotted as a function of the flight path time (UTC) in the lower x-axis and the latitude/longitude in the upper x-axis [Figure Credit: Bak et al., 2025].
Figure Description
The weather pattern of August 6 illustrates that westerlies intensified over Northeast Asia while southwesterlies and southeasterlies prevailed over southern China. This is likely associated with the southeastward shift of the WPSH system from its position in the earlier case on July 31 and its expansion to the East China Sea.
Aircraft
WB-57 (NASA/MMS), GV (NSF NCAR)
Role of MMS
To provide boundary layer height estimates, convective process characteristics, and meteorological data to better interpret pollution transport and its climate impacts.
References:
Bak, J., Liu, X.& Gonzalez Abad, G. (2024). TROPOMI research ozone profile dataset in August 2022 [Dataset]. Zenodo. https://doi.org/10.5281/zenodo.13988537
Bak, J., Kim, J., Koo, J.-H., Pan, L. L., Ryoo, J.-M., Newman, P. A., et al. (2025). An integrated analysis of ozone and carbon monoxide over the western Pacific using satellite and aircraft measurements during the ACCLIP summer campaign 2022. Journal of Geophysical Research: Atmospheres, 130, e2024JD042771. https://doi.org/10.1029/2024JD042771
ASIA-AQ 2024 (Airborne and Satellite Investigation of Asian Air Quality)
Description
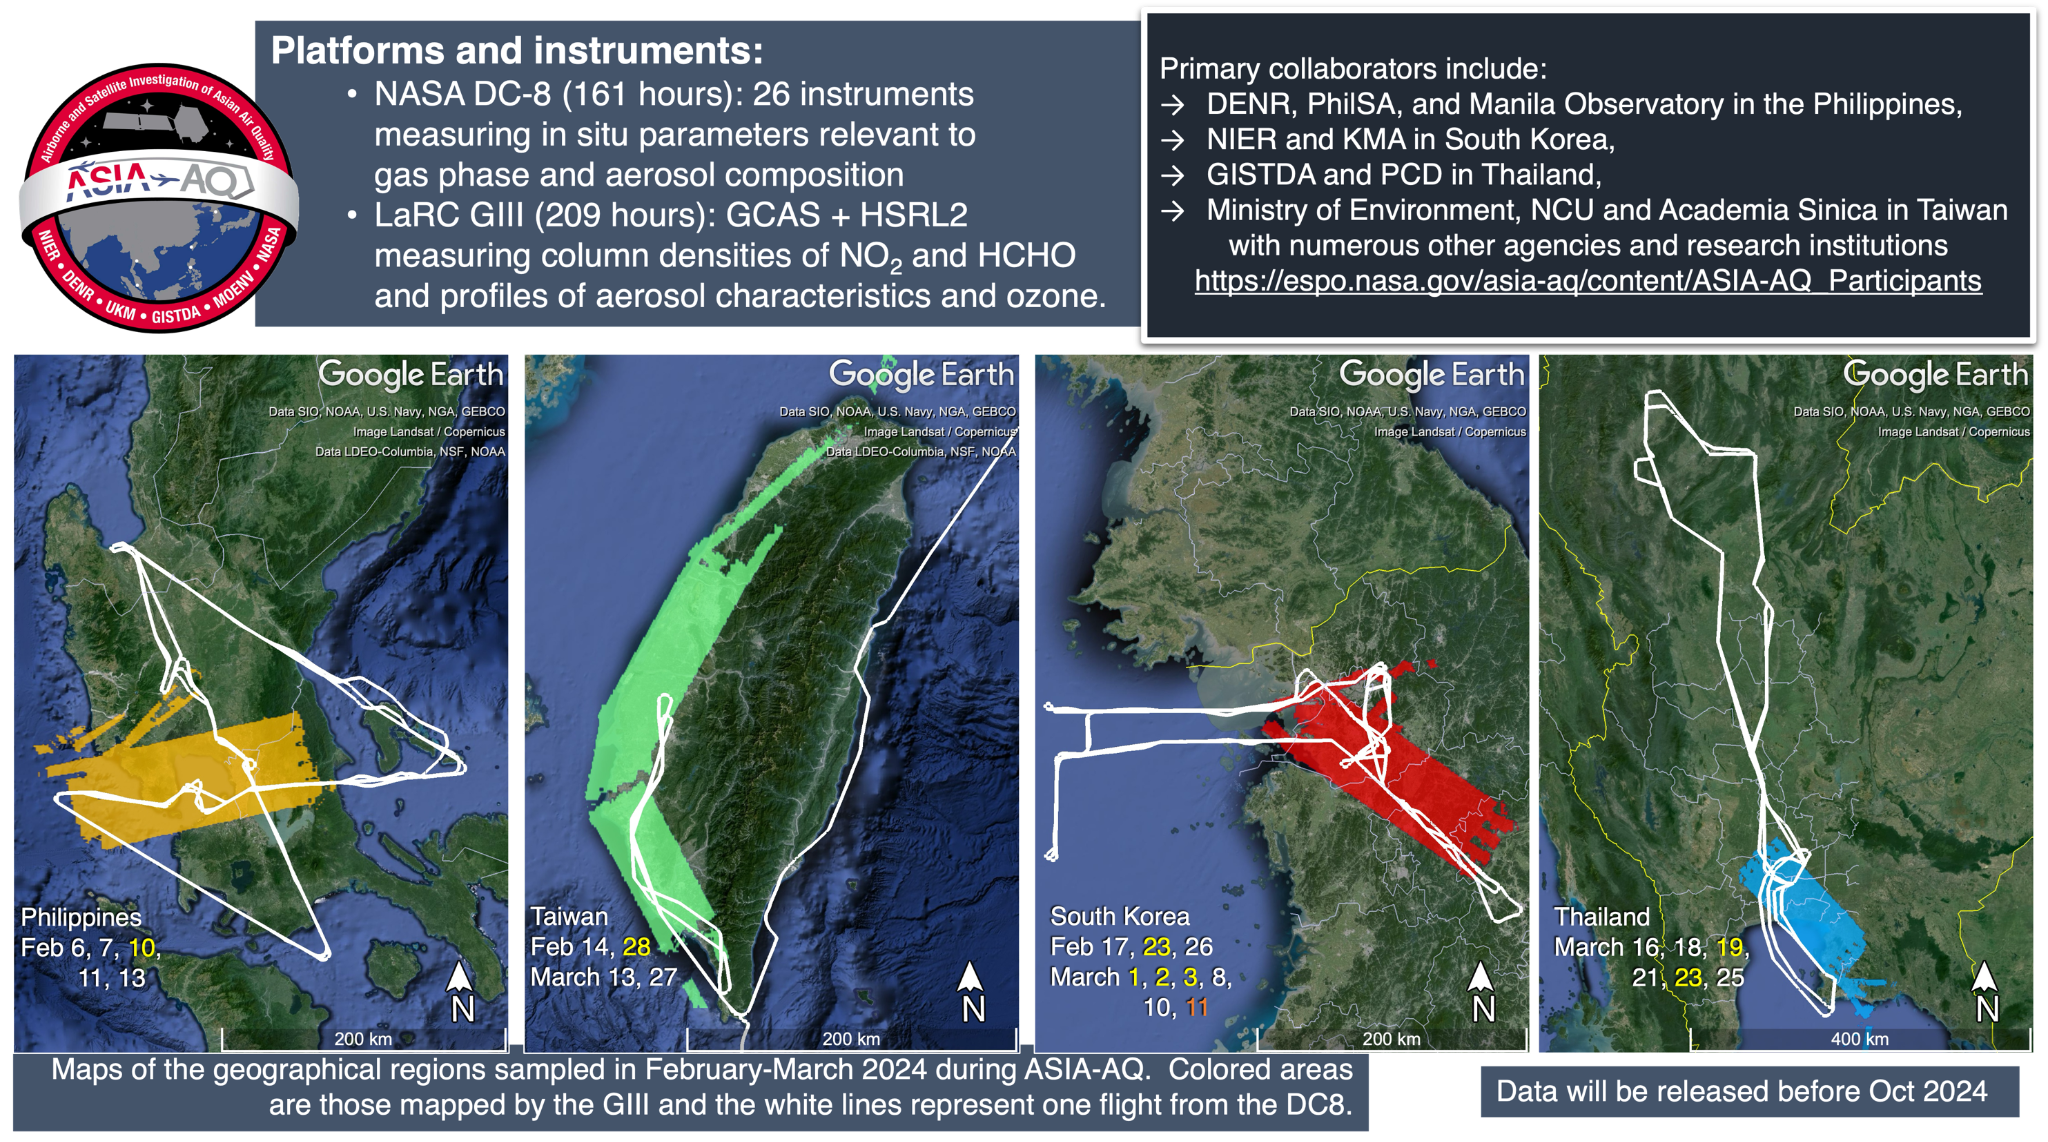
ASIA-AQ is a NASA-led international mission that integrates ground monitoring, airborne sampling, and satellite data to tackle air quality challenges across Asia. By connecting satellite observations to surface measurements, the study improves air quality models, emission characterizations, and pollutant forecasting. These integrated datasets enhance our understanding of local emission sources, ozone formation, and fine particle pollution to better inform regional air quality management.
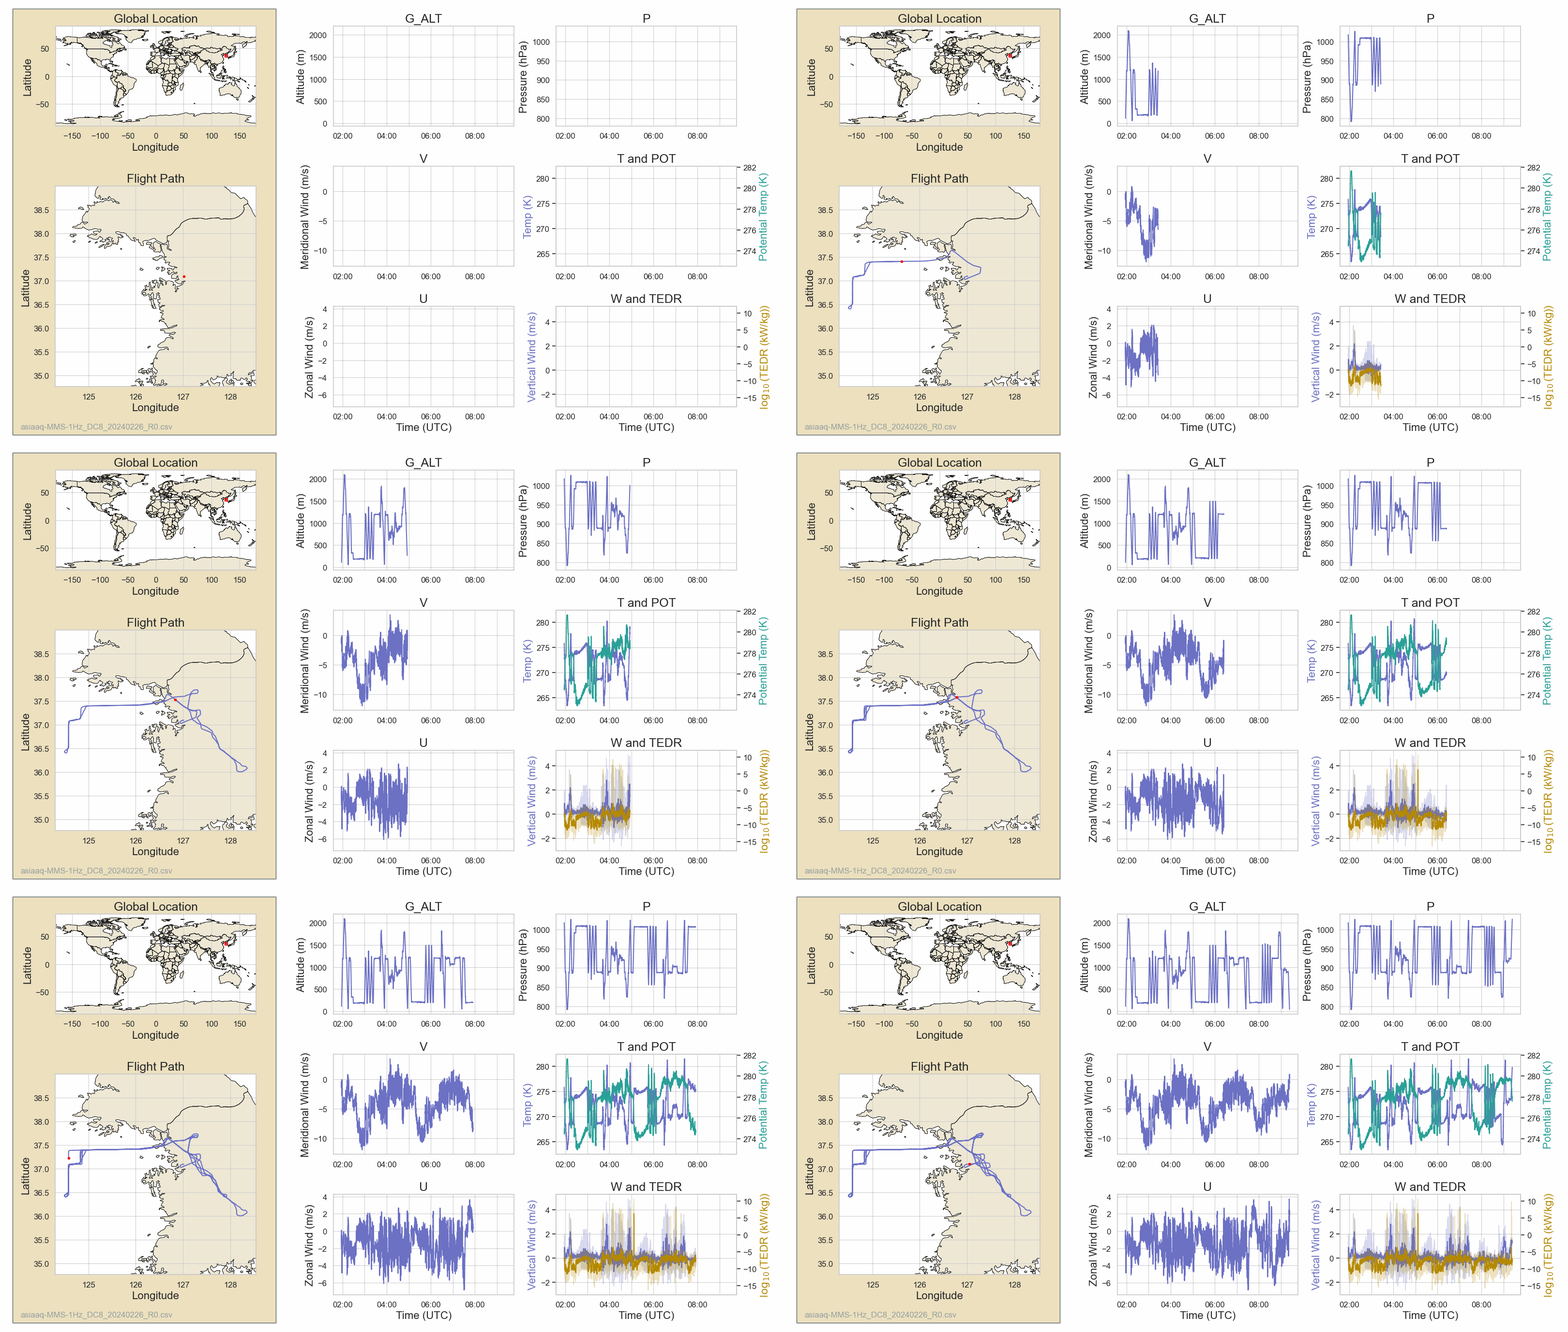
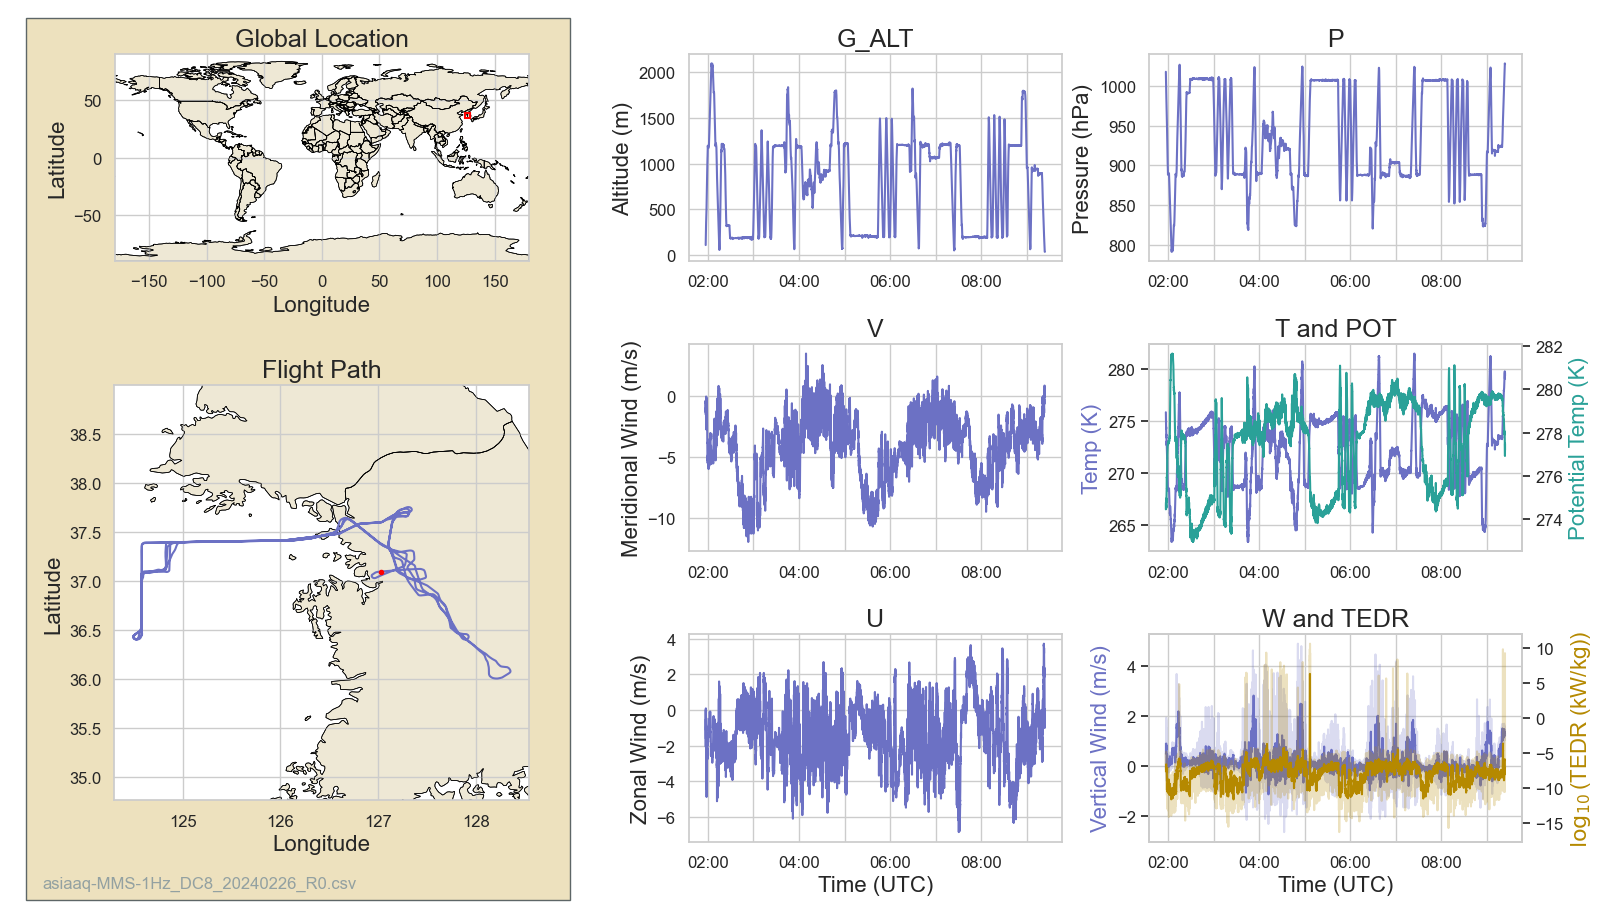
February 26, 2024 Flight:
Full Dashboard
|
Project Goal
To provide a unique, multidimensional view of pollution that is comprehensive in chemical detail and vertically resolved to provide information on the distribution of pollutants throughout the lower atmosphere.
Aircraft
DC-8
Role of MMS
To provide boundary layer processes and its height estimate and meteorological data to better interpret pollution transport.
Reference:
SABRE 2023 (Stratospheric Aerosol Budget and Radiative Effects)
Description
The overarching goal of the SABRE mission is to significantly advance our understanding of the present-day composition, chemistry, and dynamics of the stratosphere and their impacts on the climate system. SABRE measurements will greatly enhance the stratospheric observational database of the chemical, dynamical and microphysical processes that determine the formation, evolution and transport of stratospheric aerosols and their radiative properties. We seek to characterize the baseline state and variability of the stratosphere and its role in the radiative budget that determines Earth's climate.
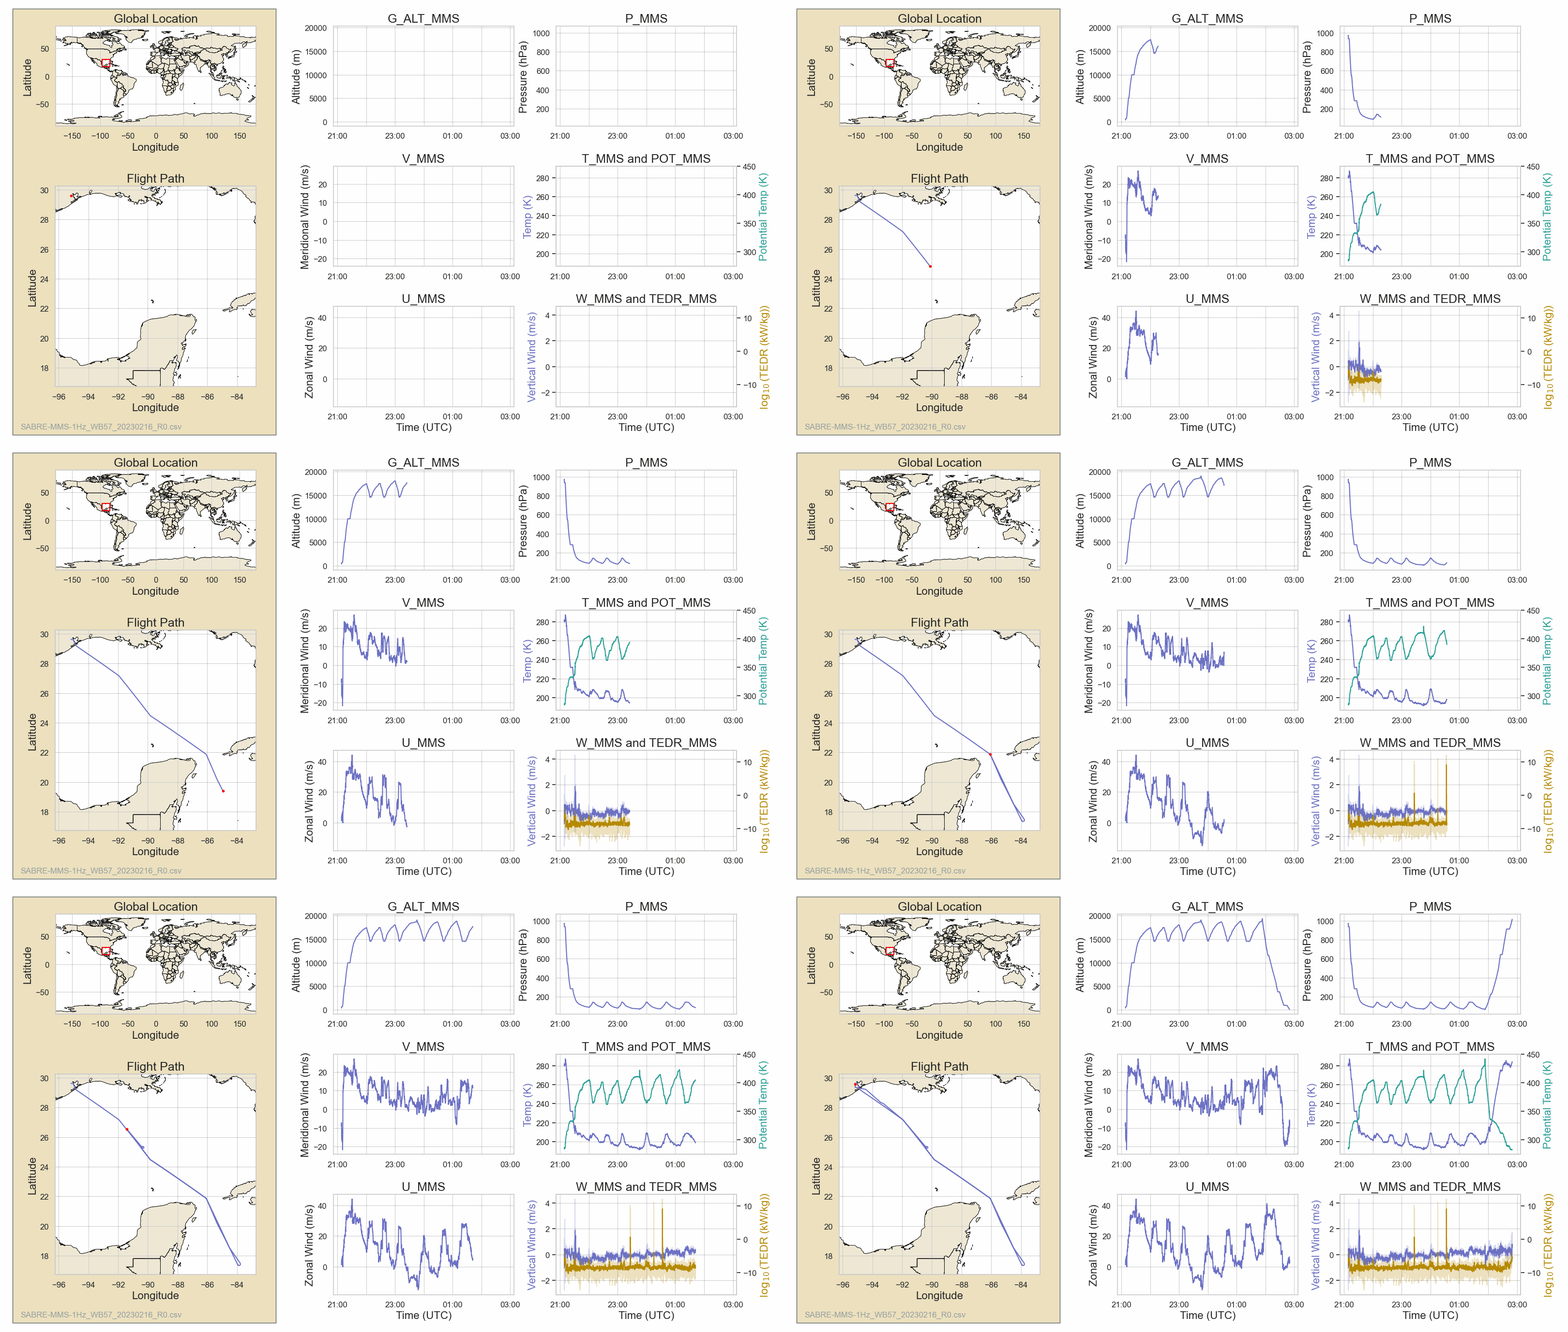
February 16, 2023
Full Dashboard
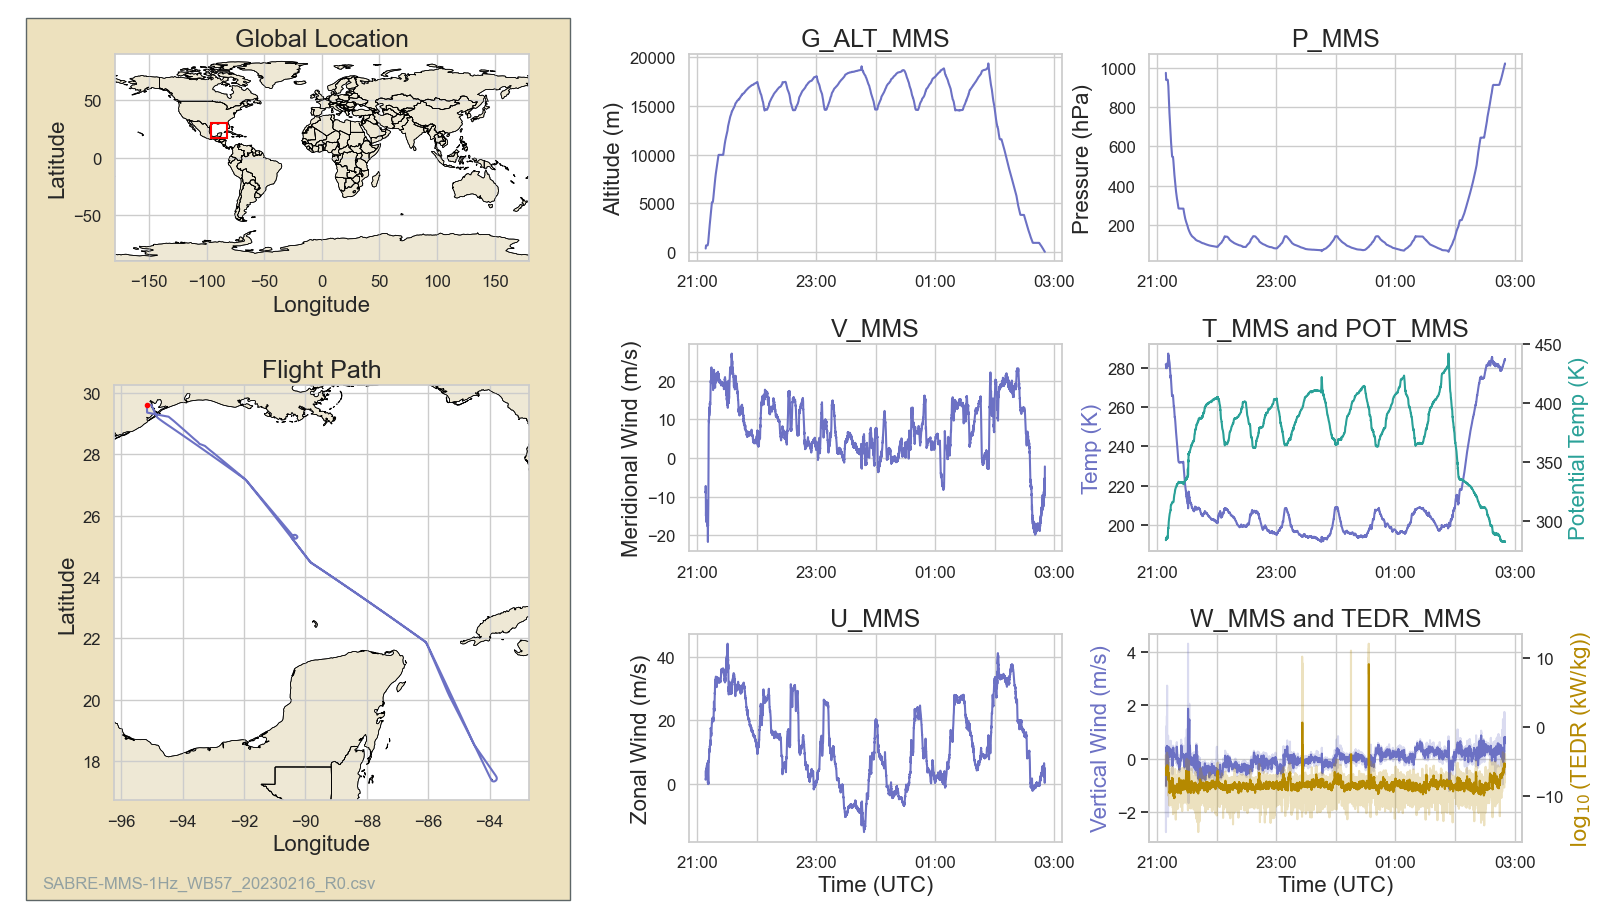
Science example: Arctic Polar Vortex Conditions During SABRE 2023 revealed in February 16, 2023 case.
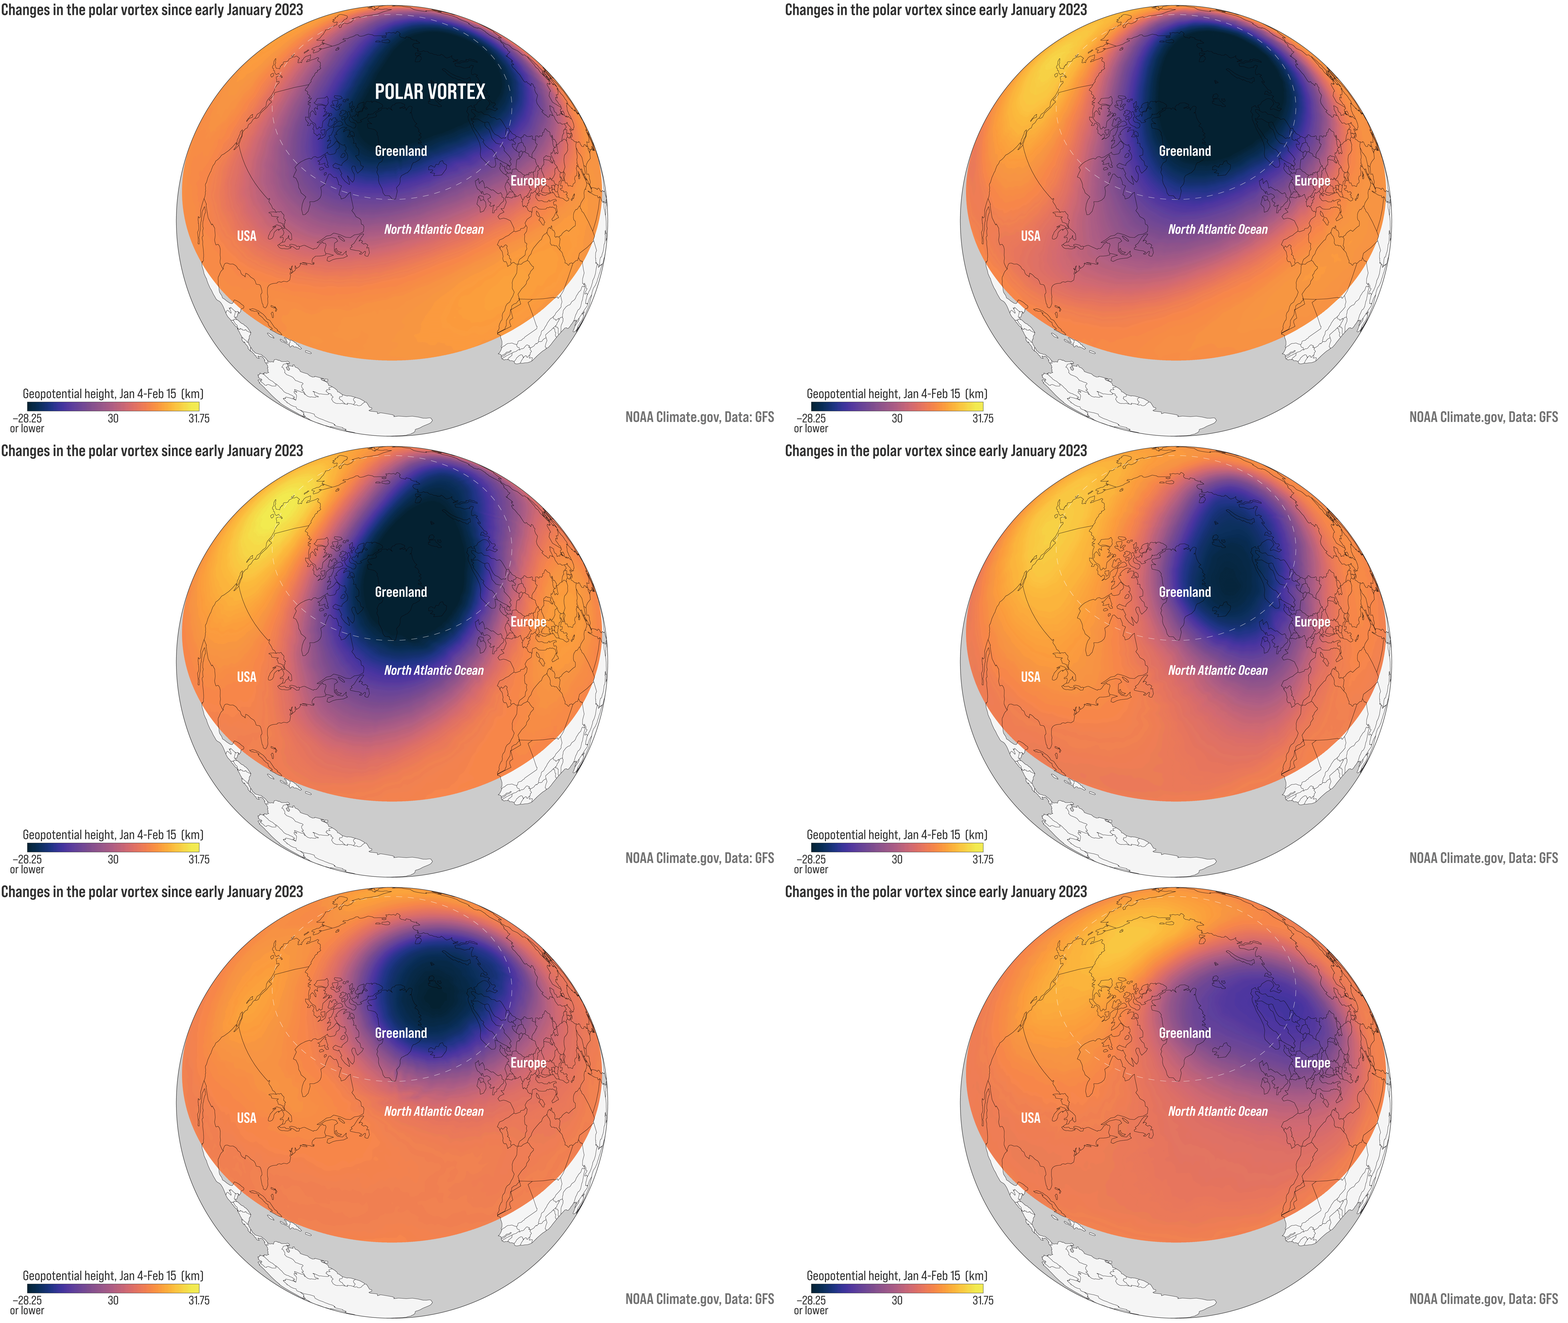 |
Figure. Disrupted polar vortex brings sudden stratospheric warming in February 2023 [Figure Credit: NOAA Climate.gov].
Figure Description
A major sudden stratospheric warming on February 16, 2023, displaced and ultimately destroyed the mid-stratospheric polar vortex, while the persistent Aleutian High pushed lower vortex remnants over Eurasia. Mid-latitude air with higher ozone remained over Alaska until mid-March, when lower vortex filaments shifted back over the region. The mid-stratospheric vortex reformed later in March, delaying the seasonal transition to summertime circulation.
Aircraft
WB-57
Reference: