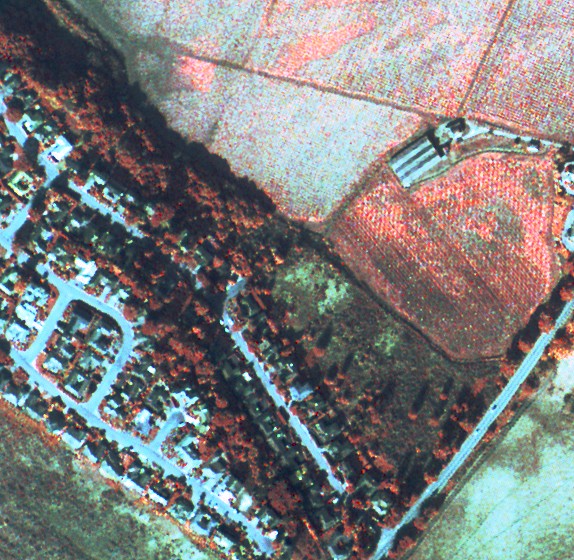
This is the "base" 1-m ARTIS image.

This is the "base" 1-m ARTIS image.

|

|
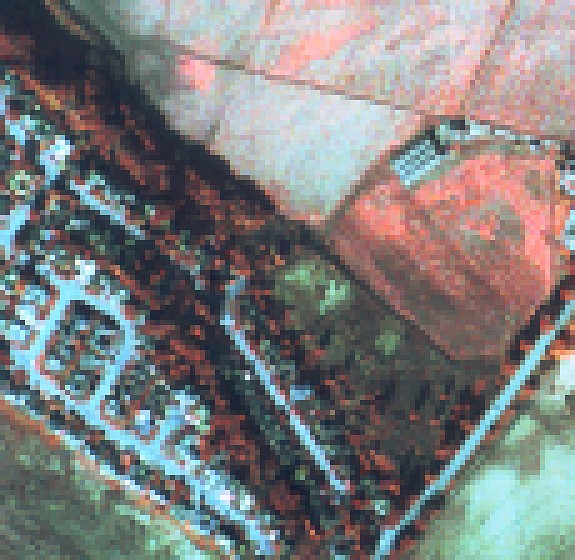
| This is 2x zoom of a simulated 2-m image of an area South of Carmel, California. | This is the same at actual (1x) size. |
|

|
| This is 5x zoom of a simulated 5-m image. | Actual (1x) size. |

|

|
| This is 10x zoom of a simulated 10-m image. | Actual (1x) size. |

|

|
| This is 30x zoom of a simulated 30-m image. | Actual (1x) size. |
 Back to the
CHAART Sensor Evaluation Resolution Comparison page.
Back to the
CHAART Sensor Evaluation Resolution Comparison page.