|
|
|
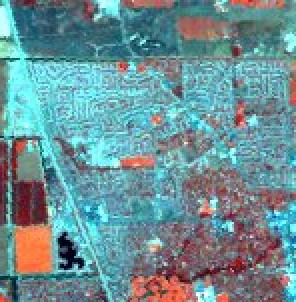
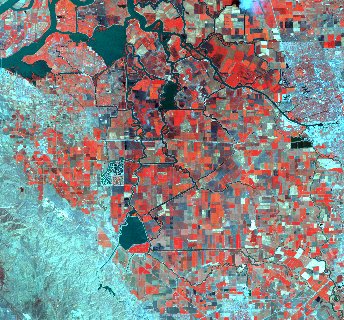
At 30 m spatial resolution, a grid pattern of agricultural fields can
be seen in various colors, from the bright red of fields with full canopy
development, to copper and brass colored fields with little canopy, to
dark blue-green of bare fields, and the very dark blue-green of wet or
burned fields. The residential areas are a maze of twisting roads with
various amounts of vegetative red.
|
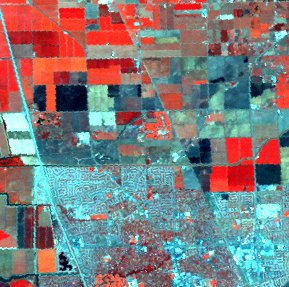
In larger fields variations can still be seen at 60-m resolution, but
residential areas are speckled with more or less dense vegetation. With
the increased area, wavy, dark curves of rivers are visible.
|
|
|
|
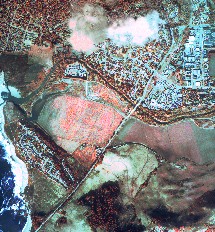
Increasing the area further with 120-m resolution, the rivers can be
seen to connect a number of lakes. At this scale the residential areas
of Stockton are fairly uniform regions of color and the agricultural
fields are smalls color chips. In the lower left are the valleys and
grooves on bare slopes of the mountains.
|
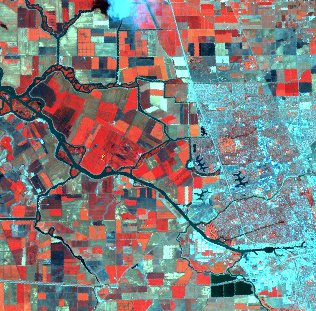
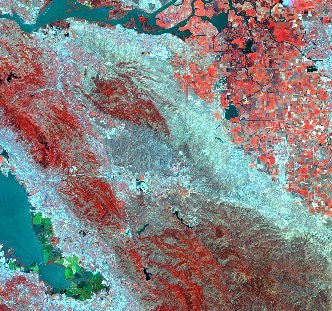
At 250-m resolution the fields are blending together and only the larger
mountain valleys can be easily seen. Roads and small rivers have also
faded away. The cities of the East Bay are a cyan and red patches,
while the Palo Alto-Atherton area has more tree canopy. Also visible
is the San Francisco Bay, with its green-color salt evaporation ponds
at the South end.
|
|
|
|
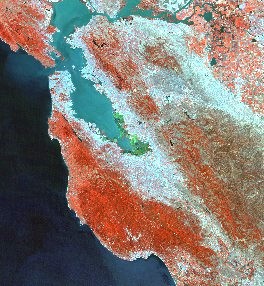
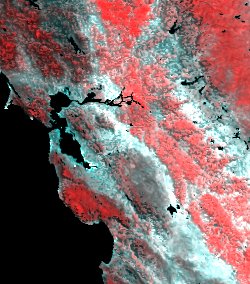
At 500-m resolution the coastal forests, mountains, and cities are
speckled, with only large distinct areas vibible. Golden Gate Park
and the Presidio can be seen at the tip of the SF Peninsula. The
small cyan point in the Bay just off the tip of the Peninsula is
Alcatraz, and the larger cyan island is Treasure Island.
|
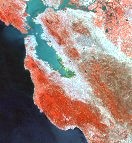
At 1000-m resolution the dense urban areas are cyan-white strips and few
details can be seen.
|
|
|
|
|
This is the same image as above right: a 30-m resolution TM image
resampled to 1000 m. As a color-infrared image, it uses three of the
TM channels: green, red, and near-infrared.
|
The above image is the same area (different date) as recorded by AVHRR
at 1.1-km spatial resolution. However, AVHRR has a red, near-infrared,
and three thermal channels, so it is a red-nearinfrared (RIR) and
thermal infrared (TIR) sensor, not a multispectral sensor like TM.
This image is actually only two bands. While the vegetation in the TM
image has an orange tint, the AVHRR image shows only red vegetation.
Major waterbodies have also been removed from the AVHRR image because
the data were obtained from the
USGS Global 1-km Land DAAC,
and the water bodies are removed as part of their processing.
|